2 Remedial Design Characterization
RDC refers to gathering of additional data, beyond general site characterization studies, necessary to develop a sufficiently detailed CSM to enable design basis for an in situ remedy. When in situ remedies fail or are less effective, it is often due to a lack of detailed understanding and an insufficiently developed CSM leading to poor design and implementation. The success of in situ remedies is directly related to a thorough understanding of site and subsurface conditions.
The RDC comprises the data required to obtain a focused understanding of the geologic, hydrogeologic, microbial, and geochemical nature of the site conditions in specific support of in situ remedial actions. The purpose of this section is to discuss these parameters as they affect in situ remediation approaches, design, and implementation.
2.1 Cost Benefits of RDC
2.1.1 Value of Investigation
The RDC will describe the data required to gain a focused understanding of the geology, hydrogeology, microbial, and geochemical nature of the site conditions in specific support of in situ remedial actions. These additional data can be used as part of the final remedy design discussed in Section 3, and have been shown to provide a value of investigation (VOI) by contributing to a successful design and implementation.
Remediation practitioners must evaluate the benefits of investigation costs against the value of the outcome. This idea of return on investigation, discussed in ITRC’s Integrated DNAPL Site Characterization and Tools Selection (ITRC 2015), referred to here as VOI, also applies in the context of the RDC. Performing an RDC will incur upfront costs beyond those for a general site characterization; however, it can be expected to result in a more successful remedial design and implementation.
Following initial site characterization, typical historical practice was to move immediately to the remedy selection and design phase, to demonstrate remedial progress quickly. This required generalizations and assumptions to be made about subsurface geology, contaminant distribution, and geochemistry. Experience over the past several decades has shown that this historical practice often leads to poor quality outcomes, repeat treatments, or in some cases, selection of a different, more appropriate remedy altogether. RDC, however, allows for a more accurate, design-level characterization, and consequently, a more effective remedial strategy, shorter remedial time frame as significant rework is not required, and lower costs over the project life cycle. This is shown conceptually in Figure 2-1, and a case study is presented in Section 2.1.2.
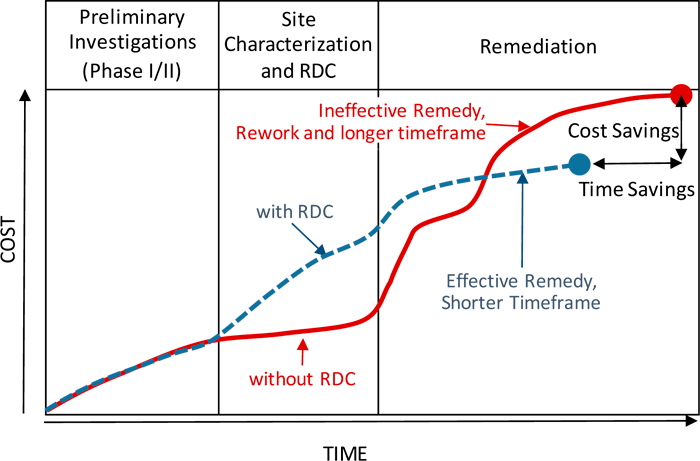
Figure 2-1. Conceptual project lifecycle costs with and without RDC.
Source: Modified from (ITRC 2015)
2.1.2 VOI Case Study
The VOI concept is well illustrated by the following project example. Soils and groundwater were impacted at an approximately 20-acre site. The geology was characterized as floodplain deposits with the target saturated zone occurring as a few-foot-thick sand lens approximately 15 feet below grade, confined within thick, hard clays above and below.
Under a tight time frame to remediate the downgradient portion of the site and plume in preparation for redevelopment, an enhanced in situ bioremediation (EISB) program was quickly implemented, using sodium lactate as the carbon source to address chlorinated aliphatic hydrocarbon contaminants. Though the geology was fairly well characterized and the injections were properly performed within the sand interval, the following RDC steps had not been implemented:
- Site-specific hydraulic conductivity was not evaluated, nor was an injection test performed to estimate the radius of influence (ROI); thus, the ROIs of the individual injections did not overlap.
- Geochemical parameters were measured, but these were not used to assess the viability of EISB at the site.
- Neither laboratory-scale nor field pilot-scale treatability testing was performed; rather, the choice of substrate and the dosing was based on data from similar sites.
- Microbial studies had not been performed to assess whether the microbial community comprised appropriate and sufficient bacteria.
Moreover, the upgradient source(s) were not addressed prior to implementation of remediation in the downgradient portion of the plume, allowing recontamination to potentially occur.
During monitoring that occurred over 2 years following the EISB program, no reductions in groundwater contamination concentrations occurred, and the geochemical properties of the aquifer at the monitoring locations were unchanged. Due to this remedy failure, site redevelopment was delayed. The site had to be recharacterized, including better definition of source areas, better plume definition, more strategically placed monitoring wells, aquifer testing to more closely estimate hydraulic conductivity and (pumping) ROI, microbial testing, and treatability studies to assess various substrates and specify dosing. In addition, the newly delineated source soils were removed. In the end, due to relatively low concentrations following source removal and low risk of back-diffusion/rebound, it was decided that the most effective remedy for the site was groundwater extraction, focusing on the source area and allowing for monitored natural attenuation in the downgradient areas.
The cost and time impacts of the project are summarized in Table 2-1. The cost of remedy failure without RDC was $380,000 and two years of delay. Had RDC been performed at the outset, the EISB program would never have been implemented, which would also have saved two years of project time. These cost and time impacts do not consider– the opportunity cost lost to the owner due to delay of site redevelopment.
Table 2-1. VOI Case Study—Cost and Time
| Item | Costs | Years | |||
|---|---|---|---|---|---|
| VOI Case Study | Hypothetical Using RDC | VOI Case Study | Hypothetical Using RDC | ||
| Initial Site Characterization | $150,000 | $150,000 | 2 | 2 | |
| Upfront RDC (Hypothetical) | $0 | $160,000 | 0 | 1 | |
| Failed Remedy | EISB Implementation | $300,000 | $0 | 1 | 0 |
| EISB Monitoring | $80,000 | $0 | 1 | 0 | |
| Rework (RDC & Remedy) | RDC (as part of rework) | $160,000 | $0 | 1 | 0 |
| Remedy Implementation | $200,000 | $200,000 | 1 | 1 | |
| Monitoring and Closure | $70,000 | $70,000 | 1 | 1 | |
| Totals | $960,000 | $580,000 | 7 | 5 | |
| Cost Savings and Time Saved with RDC | $380,000 | 2 | |||
2.2 Characterization Parameters for Refining the CSM
Understanding the heterogeneity of the subsurface, its influence on the distribution and transport of contaminants, and the hydrogeochemical fate of dissolved, separate phase, and sorbed contaminants at a level of characterization required for a successful in situ remedy depends on: (1) delineation of lithology/stratigraphy, fracture characteristics, and soil/aquifer properties that define flow characteristics and soil-water-contaminant interactions; (2) geochemistry and mineralogy that identifies, for example, competing electron acceptors or metals mobilization risks; and (3) characterization of the microbial community and other factors that provide a measure of contaminant degradation or immobilization potential.
Table 2-2 provides a comprehensive (but not exhaustive) list of characterization parameters relevant for in situ remediation. The table provides a general guidance on the relevance of these parameters for biotic and abiotic in situ remedies, and the stage at which they should be considered (e.g., during the screening process for selecting the most appropriate amendment and delivery strategy; during remedial design; and/or during implementation and performance monitoring). Parameter definitions and further explanation can be viewed by hovering over the parameter term in the left column of Table 2-2.
Table 2-2. Characterization parameters for in situ treatment remedies
| Parameter | In situ Approach | Remediation Phase/Step | |||
|---|---|---|---|---|---|
| Abiotic | Biotic | Alternatives Screening | Remedial Design | Performance Monitoring | |
| Physical Properties | |||||
| Provenance and Mineralogy | M | M | HIGH | MEDIUM | LOW |
| Stratigraphy | M | M | MEDIUM | HIGH | LOW |
| Degree of Weathering of Geologic Formation | M | M | MEDIUM | HIGH | LOW |
| Fracture Representative Aperture and Length | M | M | MEDIUM | HIGH | LOW |
| Fracture Connectivity/Rock Quality Designation | M | M | MEDIUM | HIGH | LOW |
| Fracture Orientation | M | M | MEDIUM | HIGH | LOW |
| Grain Size Distribution | M | M | LOW | HIGH | LOW |
| Bulk Density | M | M | LOW | HIGH | LOW |
| Fraction of Organic Carbon | M | M | MEDIUM | HIGH | LOW |
| Primary and Secondary Porosity | M | M | MEDIUM | HIGH | LOW |
| Flow Properties | |||||
| Flow Regime | M | M | HIGH | HIGH | HIGH |
| Groundwater Occurrence and Variability | M | M | HIGH | HIGH | HIGH |
| Hydraulic Conductivity | M | M | HIGH | HIGH | LOW |
| Degree of Heterogeneity | M | M | HIGH | HIGH | LOW |
| Anisotropic Orientation | M | M | HIGH | HIGH | LOW |
| Effective Porosity | M | M | HIGH | HIGH | LOW |
| Velocity/Flux | M | M | HIGH | HIGH | HIGH |
| Aqueous Geochemistry | |||||
| pH | M | M | HIGH | HIGH | HIGH |
| Temperature | M | M | HIGH | HIGH | HIGH |
| Alkalinity | M | M | HIGH | HIGH | HIGH |
| Conductivity, Salinity, and Total Dissolved Solids (TDS) | M | M | MEDIUM | MEDIUM | MEDIUM |
| Oxidation-Reduction Potential (ORP) | M | M | HIGH | HIGH | HIGH |
| Dissolved Oxygen (DO) | M | M | HIGH | HIGH | HIGH |
| Nitrate (NO3–) | L | M | HIGH | HIGH | MEDIUM |
| Nitrite (NO2–) | L | M | LOW | LOW | MEDIUM |
| Manganese Manganic (Mn+4) | L | M | LOW | MEDIUM | MEDIUM |
| Manganese Manganous (Mn+2) | L | M | MEDIUM | MEDIUM | MEDIUM |
| Ferric Iron (Fe+3) | M | M | LOW | HIGH | HIGH |
| Ferrous Iron (Fe+2) | M | M | MEDIUM | HIGH | HIGH |
| Sulfate (SO42-) | M | M | HIGH | HIGH | HIGH |
| Sulfite (SO32-), Sulfide (S2-) | M | M | LOW | MEDIUM | HIGH |
| Chloride (Cl–) | L | M | MEDIUM | LOW | MEDIUM |
| COD (chemical oxygen demand) | L | L | LOW | LOW | LOW |
| SOD (soil oxidant demand) | M | L | MEDIUM | HIGH | LOW |
| TOD (total oxidant demand) | M | L | MEDIUM | HIGH | LOW |
| NOI (natural oxidant interaction) | M | L | MEDIUM | HIGH | LOW |
| TOC (total organic carbon) | M | M | MEDIUM | HIGH | MEDIUM |
| Anions, cations | Individually listed | ||||
| Arsenite (As+3) | M | L | LOW | MEDIUM | HIGH |
| Arsenate (As+5) | M | M | MEDIUM | HIGH | MEDIUM |
| Chromium (Cr+3) | M | M | MEDIUM | HIGH | MEDIUM |
| Chromium (Cr+6) | M | L | LOW | MEDIUM | HIGH |
| Other Heavy Metals (e.g., lead, copper, selenium) | L | L | LOW | MEDIUM | MEDIUM |
| Microbiology | |||||
| Stable Isotope Probing | L | M | LOW | MEDIUM | MEDIUM |
| PLFA (Phospholipid Fatty Acids) | L | M | LOW | MEDIUM | MEDIUM |
| qPCR (Quantitative Polymerase Chain Reaction) | L | M | LOW | MEDIUM | MEDIUM |
| Degradation Potential | |||||
| CSIA (ITRC 2013a) (Compound-Specific Isotope Analysis) | M | M | LOW | MEDIUM | MEDIUM |
| Dissolved Hydrocarbon Gases (Methane, Ethane, Ethene, Acetylene, Propane, Propene) | M | M | LOW | LOW | MEDIUM |
| Carbon Dioxide (CO2) | L | M | LOW | LOW | MEDIUM |
| Magnetic Susceptibility | M | L | MEDIUM | LOW | LOW |
| Legend | |||||
| More applicable | M | ||||
| Less applicable / not applicable | L | ||||
| LOW | |||||
| Relative importance of data at the remediation phase indicated | MEDIUM | ||||
| HIGH | |||||
These parameters help refine the CSM at the onset of in situ remediation planning. General guidance for preparing and refining the CSM has been discussed in previous ITRC documents (ITRC 2011c, 2017a). RDC is an effort to refine the CSM prior to the remedial design stage. This refinement begins with a careful review of the existing CSM in context of the in situ treatment options being considered for the site target treatment zone (TTZ, See section 3.2.1) and developing the data collection objectives to fill the data gaps that reduce uncertainties in the design and implementation of the considered in situ remedy (or remedial options). Site parameters that control the amendment delivery in the subsurface, and establishing contact between target contaminants and amendments, are critical to treatment success. Furthermore, higher resolution data, or data density, increases the likelihood of treatment success (Appendix E-3, Rapid Site Closure of a Large Gas Plant Using In situ Bioremediation Technology in Low Permeability Soil and Fractured Rock Case Study).
Through RDC, the CSM will continue to improve and evolve as the site moves from feasibility study to design, remedy implementation, monitoring and evaluation, and subsequent optimization efforts. Furthermore, data collected at each stage of bench study, pilot testing, and full-scale implementation can and should be used to continue to refine the CSM. This philosophy of updating the CSM during each remediation stage is consistent with the adaptive management principles discussed in Characterization and Remediation of Fractured Rocks (ITRC 2017b); Integrated DNAPL Site Strategy (ITRC 2011c); and Superfund Task Force Recommendation #3: Broaden the Use of Adaptive Management, July 3, 2018. This is further discussed in Section 3.1 and depicted in the design wheel of Figure 3-1.
2.3 RDC Considerations
The main considerations of in situ RDC are:
- remedy performance objectives
- site characteristics
- contaminant distribution
- geology and hydrogeology
- geochemistry and microbiology
2.3.1 Remedy Performance Objectives
Remedy performance objectives, or expectations, provide a framework to measure key milestones and associated risk reductions. Although the (ITRC 2011c) discusses the overall remedy performance objectives in detail, the purpose of this section is to describe the characterization needs pertaining to remedy performance objectives for injection-based remedies in particular. Key components of performance objectives specific to these types of remedies include a defined TTZ where the remedy will be implemented, and in what depth intervals, the expectations in terms of observations and outcomes during and after the injections, and time frame for the observations and outcomes of the remedy. These concepts are discussed further below.
2.3.2 Site Characteristics
In addition to the hydrogeologic and hydrogeochemical characteristics presented in Table 2-2, a first step in the RDC includes planning for general site characteristics, both natural and anthropogenic. For example, to ensure appropriate access for reagent delivery, a sufficient understanding of utility corridors and how they may impact injection point placement is necessary. Additional site characteristic items are discussed in Table 2-4.
Table 2-4. General site characteristics
| Accessibility | Definition | Physical, logistical, or legal obstacles to predesign characterization and implementation at the site (e.g., building locations, roads, subsurface utilities and tank systems, high traffic areas, overhead utilities, small property size, vegetation, property security). |
| Impact | Site accessibility influences the design and implementation of some technologies more than others, due to equipment size, degree of work space footprint, below-grade utilities, etc. Technologies that require a larger work space footprint may be less feasible to implement. There may also be challenges related to targeting contamination that is located under buildings or roads or within mechanized equipment exclusion zones for utilities, tank systems, etc. Often there is limited ability to characterize these areas and their impact on design and dosing. There are further challenges related to the potential for vapor intrusion into buildings. | |
| Sensitive to Disturbance Areas | Definition | An area with a high likelihood for disturbance or disruption of normal activities (e.g., residences, schools, businesses, wildlife, etc.) due to noise, increased traffic, or physical obstruction. |
| Impact | At sites with more potential for disruption such as nearby businesses or residential areas, certain technologies may be less feasible, or additional planning and coordination may be necessary to reduce disruption and ease public concern during disruptive activities such as drilling, piping installation, sampling, or interruption of normal traffic and utility use. | |
| Health and Safety | Definition | Regulations and procedures intended to prevent illness, accident, or injury at work spaces and public environments. Safety considerations apply to field crews, consultants, regulators, and the general public. |
| Impact | Site-specific safety considerations may limit the use of certain technologies. Additional planning may be necessary to address special handling and use of certain amendments and to ensure that work crews are specially trained and experienced with the chosen technology. Considerations for site security, fencing, lighting, and traffic control are important early on in the design process. | |
| Utility Availability | Definition | The presence and usability of water supplies, electricity, sewer, and stormwater infrastructure at a site. |
| Impact | Some technologies require large amounts of water for injections as well as electricity for equipment. Some technologies may be less feasible in remote areas, or additional planning may be necessary to gain access to these utilities. Coordinating water transport and storage, fuel storage, and waste disposal should be considered during the design process. | |
| Sensitive Receptors | Definition | Any feature that may be adversely affected by hazardous materials, remedy construction, and operations. This would include public drinking water sources; endangered species; protected wetlands, riparian habitats, or other sensitive ecological areas; cultural sites; schools/daycares; and hospitals. |
| Impact | Sensitive receptors may impact the design and implementation of some technologies more than others, due to restrictions of equipment size, work space footprint, operation times, and amendment selection, etc. | |
| Current and Future Land Use | Definition | The classification of land according to what activities take place on it or how humans occupy it, including future restrictions on land use and zoning. |
| Impact | The proposed design may need to account for current or future infrastructure and potential restrictions due to area zoning. Deed or site usage restrictions may be necessary to prevent potential exposure pathways. | |
| Former Operations | Definition | Detailed understanding of the different operations and processes at a site and the types of chemicals used and stored, along with the locations of these operations and storage areas. |
| Impact | Past activities at the site should be taken into consideration to help refine the CSM. For example, not all activities may be related to the contaminant of concern, but may be important when evaluating the potential for mobilization of other compounds (e.g., metals, PFAS) or evaluating preferential pathways due to historical placement of fill or dumping areas. | |
| Buried Infrastructure | Definition | Subsurface features including utilities (water, sewer, electric, communications, natural gas, stormwater, etc.), underground storage tanks, and drainage networks (modern and historic). |
| Impact | Reduce chances of damage to buried infrastructure during remedy construction and operation with effective remedy design. Identify features that may facilitate chemical interactions and create conduits for chemical or amendment migration. Buried infrastructure may create pathways for injected material to migrate in undesired areas and for vapors to travel into buildings. |
2.3.3 Contaminant Distribution
A detailed, three-dimensional understanding of contaminant distribution (ITRC 2016) is necessary to minimize uncertainty associated with selection and implementation of in situ remedies. Following a typical site characterization, the contaminant plume will generally be delineated areally and a contour map drawn using a widely spaced monitoring well network or grab groundwater data. Such maps are useful to identify higher concentration areas to focus on for remediation, but due to the sparsity of the data, can often overestimate treatment areas. Similarly, vertical discretization of contamination will provide focus on targeted injection intervals, compared to arbitrarily long intervals perceived from monitoring well data. A better approach is to refine areal and vertical contaminant distribution as part of an RDC. The cost benefits of such an RDC are discussed in Section 2.1 and illustrated by a project example in Section 2.1.2.
A detailed, three-dimensional picture of contaminant distribution is also necessary to decide upon the in situ approach, which typically takes one of two forms: (1) focus in situ remediation on high concentration source and hot spot areas, allowing natural processes to attenuate the distal, low-concentration plume; or (2) implement in situ remediation as a long-term, downgradient control mechanism, with tightly spaced injections forming a reactive zone through which contamination is treated as it flows under the natural gradient.
As well, knowledge of the contaminant phases—that is, light nonaqueous phase liquids (LNAPL), dense nonaqueous phase liquids (DNAPL), aqueous, sorbed (in the case of organics), mass and dissolved or precipitated (in the case of metals)—is necessary to identify the most effective in situ strategy, or whether in situ would be effective at all. For example, amendment loading and delivery approaches will be different for separate phase contamination versus aqueous (as will be discussed in Section 3), and in the case of strongly sorbing compounds, neglecting to include the sorbed fraction will result in underestimated amendment dosing. Further, due to back-diffusion from lower permeability matrices, multiple injection events may be needed, which is another design element that must be considered and understood at the outset.
Multiple tools are available to enable high-resolution contaminant characterization and related geologic and hydrogeologic data. Description, use, and implementation strategies are presented in ITRC’s Implementing Advanced Site Characterization Tools document (ITRC 2019).
2.3.4 Geology and Hydrogeology
The general concept that contaminants migrate via the more advective pathways such as more permeable, coarser-grained sand or highly fractured bedrock, and are stored or sequestered in low permeability, finer-grained matrices is a key aspect for approaching injection-based technology designs. Ultimately, more permeable media, rock, and fractures control the advancement of injection fluids both vertically and laterally from a delivery point. However, the less permeable formations, which limit the injectates to be in contact with the contaminants present in the tighter formations, will eventually determine the success or failure of the in situ remedies. These features play a significant role in the advective and diffusive distribution of amendments following delivery. Although classical hydrogeologic interpretations remain important, a more focused understanding of specific site aquifer flow parameters and contaminant transport is required to ensure that the objectives of the injections are achieved.
Geologic (aquifer physical properties) and hydrogeologic (aquifer and groundwater flow properties) elements important to the RDC are listed in Section 2.2. In addition to these properties, tracer or injection tests can be used as part of an RDC, or during the initial injection event, to develop or validate the key assumptions used in the design. Tracer tests may include an inert tracer (e.g., salts such as bromide, fluorescent dyes, isotopes) or a component of the amendment. Depending on the objectives, the amendment itself may serve as a pseudo tracer. In this case, components of the amendments (e.g., sulfate from a persulfate injection, or purple color from a permanganate injection, total organic carbon (TOC), increased dissolved oxygen (DO), or white color or turbidity from some emulsions) can be used for short-term assessments, such as evaluating the postinjection volume-radius relationships, and immediate dilution of the amendment following injection. As these types of injection tests do not intentionally include an inert tracer, they may not accurately be able to satisfy potential longer data collection needs (that is, groundwater velocity), because the amendment components themselves can be reactive, biodegrade, or sorb to soil matrix surfaces.
Tracer or injection testing ideally should be conducted at the beginning of an injection-based remedy. However, these tests can be performed at any point during an injection program. Data collected as part of a tracer or injection test can be used for several activities, including optimizing the injection program, (see Section 4.4.1) troubleshooting problem areas (see Section 4.5), evaluating the cost benefit of supplemental injection infrastructure, or evaluating use of a different amendment and/or amendment strength. Additional information on design of an appropriate field test (including use of tracers) can be found in Section 3.3.3.
2.3.5 Geochemistry and Microbiology
The geochemical parameters and microbial populations present in a hydrogeologic setting provide critical information that feeds into in situ remediation selection (that is, aerobic or anaerobic biostimulation, chemical oxidation or reduction) and design. They also provide a pre-remediation baseline, which enables the practitioner to evaluate remedy performance. Each geochemical and microbial parameter is discussed in these contexts in Table 2-2.
In situ technologies can be broadly categorized into two types: biotic and abiotic. Abiotic technologies are further differentiated into in situ chemical oxidation (ISCO) and in situ chemical reduction (ISCR, which can also include biotic breakdown), and activated carbon–like sequestration. Chemical remedies will directly destroy (for organics) or modify (for metals) the target contaminant via chemical reactions. Biological remedies enhance or promote microbial reactions to achieve performance goals either by stimulating existing microbes (biostimulation), or by adding specialized microbes (bioaugmentation). The different types of in situ chemical and biological amendments associated with these remedies are discussed in greater detail in Section 3.4 and Amendment fact sheets.
A method to evaluate the current state of an aquifer is to start with a monitored natural attenuation (MNA) assessment. Several existing documents provide great detail on performing an MNA assessment (USEPA 1998; ITRC 2008a), and can be used as a baseline for design of any in situ treatment strategy, or as a basis for screening out a technology. Establishing new processes or changing the current state of an aquifer is possible, but can be difficult, costly, and take a long time to implement. Regardless of the type of remedy (chemical or biological), it is recommended to conduct a baseline rate assessment to define the initial degradation rate prior to injection of an amendment. This will allow for a before and after evaluation to determine whether the in situ injection–enhanced degradation rates are sufficient to meet performance objectives.
The following sections detail data that can be used to support screening the type of in situ injection technology and associated amendment.
2.3.5.1 Degradation Products and Microbiology
When remedies that include biotic technologies are under consideration, an analysis of biological degradation products (where applicable) should be completed as part of the screening process. For example, light gas data (methane, ethane, ethene, acetylene) should be collected in addition to volatile organic compound (VOC) data (including degradation daughter products) at chlorinated sites to assess whether complete reductive dechlorination by native microbes is already occurring at the site.
Collection of microbial data can be used as another line of evidence for the support of a biological remedy. Several microbial tools are available for use in site assessment (ITRC 2013a), with new technologies frequently brought to market. One of the most commonly used and commercially available tools for pre-assessment is quantitative polymerase chain reaction (qPCR), in which key species or functional genes can be evaluated in soil and/or groundwater. The results of these tests can determine presence/absence and relative abundance of microbes or functional genes prior to biostimulation activities. Several other tools are also available for microbial testing, with the best tool dependent on the type of information needed to support the assessment (ITRC 2013a).
2.3.5.2 Geochemistry
Collection of baseline geochemistry data is suggested from locations within, and outside of, the contaminant plume. Several locations may be desired for sampling, including within a source area, the dissolved core of the plume, the toe of the plume, and upgradient or side-gradient of the plume (for background information). Geochemical data typically collected during an MNA study are listed and described in Table 2-2. Figure 2-2 shows how the geochemical data can be used to evaluate reducing conditions. As one goes down the table progressively reducing groundwater conditions are indicated. Select contaminants are included for reference.
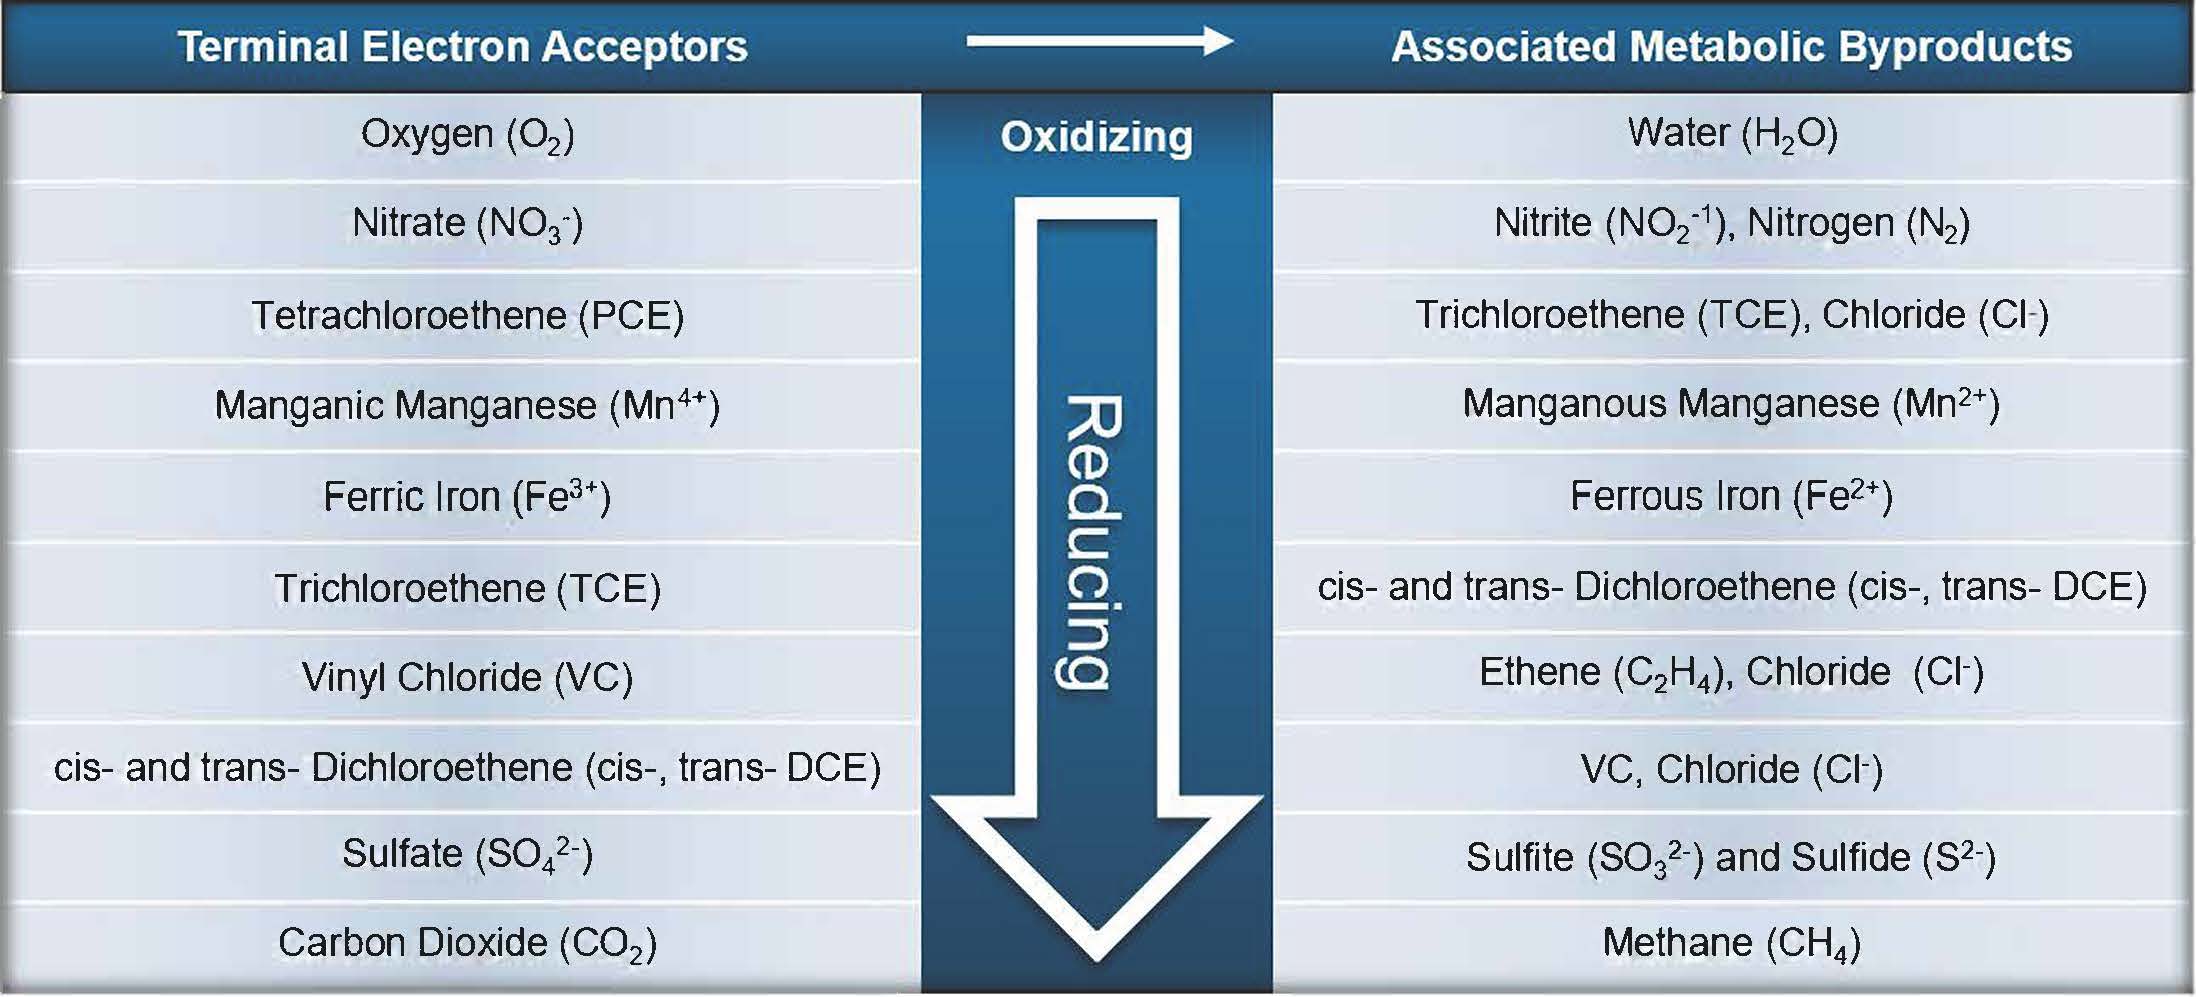 Figure 2-2 Terminal electron receptors and associated metabolic products in order of reaction preference.
Figure updated 7/21/2022.
Together these data can be used to evaluate overall reducing or oxidizing conditions within different areas of the plume. For example, nondetect nitrate, elevated dissolved manganese, elevated dissolved iron, and elevated sulfate suggests the aquifer is in iron-reducing conditions, potentially moving into sulfate-reducing conditions. The most reducing environment (methanogenesis) will have no nitrate, elevated manganese and iron, low sulfate, and elevated methane present. If nitrate is elevated and no dissolved manganese or iron is present, then the aquifer is likely in aerobic conditions.
Understanding the baseline geochemical environment is also critical for chemical remedies. In the instance of ISCO processes, background demand of oxidant is required to ensure that enough oxidant is delivered to the subsurface to overcome the background demand and still have enough oxidant concentration remaining to react with the contaminant. For some oxidants (for example, persulfate), the presence of ferrous iron can be a benefit if it is in a form and at concentrations high enough to activate persulfate without requiring the addition of another type of activator (for example, alkaline pH, hydrogen peroxide, chelated iron). If an aquifer is fairly reduced, a quantitative assessment of background demand and/or ambient activation is recommended through laboratory analysis or bench testing of the aquifer material (see Section 3.3.2), groundwater, and oxidant to ensure that the chemical amendment is properly designed to meet remedial objectives.
2.3.5.3 Secondary Water Quality Considerations
Consideration of secondary water quality impacts from amendments and subsequent reactions of in situ processes should be included during the screening step. For example, Figure 2-2 indicates that reducing conditions can liberate some metals species as a negative ORP shift can affect redox-sensitive metal speciation or produce hydrogen sulfide and metal sulfide complexes. The addition, and subsequent fermentation of a carbon substrate, will create reducing conditions in an aquifer, and if the aquifer was not already reducing, there will be a release of redox-sensitive metals (for example, manganese, iron, arsenic), color variations and an abnormal odor (surface discharge). During ISCO applications oxidation of trivalent chromium into mobile hexavalent chromium has been observed at many sites. The magnitude of concentration changes of these metals will depend on the site-specific mineralogy of the TTZ. The release of these metals is generally limited to the footprint of the TTZ, as the groundwater will restore to ambient conditions typically outside of the active reaction zone. Most of the time this is not a cause for concern, but consideration for this should be included during the evaluation, especially if a sensitive receptor is present near the TTZ (see Section 3.2.2).
Click here to download the entire document.

