• Skip to main content
itrc_logo

Optimizing Injection Strategies and In situ Remediation Performance

Home
About ITRC
Navigating this Website
1 Introduction
1 Introduction Overview
1.1 The Problem and the Need for Optimization
1.2 Intended Audience
1.3 Approaches to Optimizing an In Situ Remedy
1.4 Document Organization
2 Remedial Design Characterization
2 Remedial Design Characterization Overview
2.1 Cost Benefits of RDC
2.2 Characterization Parameters for Refining the CSM
2.3 RDC Considerations
3 Amendment, Dose, and Delivery Design
3 Amendment, Dose, and Delivery Design Overview
3.1 The Design Wheel and Optimization Process
3.2 Design Considerations
3.3 Design Support Elements
3.4 Amendment Selection Considerations
3.5 Amendment Dose Requirements
3.6 Amendment Delivery Optimization
3.7 Delivery Layout Design and Volume per Location
3.8 Delivery Strategies
4 Implementation and Feedback (Monitoring) Optimization
4 Implementation and Feedback (Monitoring) Optimization Overview
4.1 Pre-implementation Considerations
4.2 Adaptive Implementation and Feedback Optimization
4.3 Implementation and Optimization Staircase
4.4 Monitoring
4.5 Implementation Optimization
4.6 Transition and Contingency Planning
5 Regulatory Perspectives
5 Regulatory Perspectives Overview
5.1 Statutory Challenges
5.2 Traditional CERCLA Site Cleanup Process
6 Community and Tribal Stakeholder Considerations
6 Community and Tribal Stakeholder Considerations Overview
6.1 Background
6.2 Identifying Stakeholders
6.3 Stakeholder Concerns
6.4 Approach to Stakeholder Engagement
6.5 Communications
Additional Information
Appendix A. Amendments and Other Additives
Appendix A. Amendments and Other Additives Overview
A1 Common Biotic Amendments
A2 Abiotic Amendments
A3 Other additives
Appendix B. Commonly Encountered Issues with In situ Remediation
Appendix C. Characterization Parameters for In situ Treatment Remedies–Definitions and Descriptors for Table 2-2
Appendix C. Characterization Parameters for In situ Treatment Remedies–Definitions and Descriptors for Table 2-2 Overview
Physical Properties
Transport Properties
Aqueous Geochemistry
Degradation Potential
Appendix D. Injection Fact Sheets
Appendix D. Injection Fact Sheets Overview
D1 Direct Push Delivery Methods
D2 Injection Through Wells & Boreholes
D3 Electrokinetics Delivery Methods
D4 Solid Injection Principles
D5 Hydraulic Fracturing–Based Delivery Methods
D6 Pneumatic Fracturing–Based Delivery Methods
D7 Permeable Reactive Barrier Construction
Appendix E. Case Studies
Appendix E. Case Studies Overview
E-1. In Situ Biological and Chemical Reduction of Hexavalent Chromium and Perchlorate
E-2. Strontium-90 Apatite Permeable Reactive Barrier
E-3. Rapid Site Closure of a Large Gas Plant Using In Situ Bioremediation Technology in Low Permeability Soil and Fractured Rock
E-4. Performance of Injected Powdered and Liquid Activated Carbon at a Petroleum Hydrocarbon Site
E-5. Lawrence Livermore National Laboratory—Annual Groundwater Report
E-6. Oxidant Surface Eruption During Direct Push Injection
E-7. TerraVac Under EPA’s Demonstration Program Conducted SVE in the Source Area
E-8. Unusual Dichloroethylene Isomerizations and External Nitrate Input to Help Decipher in Situ Pilot Test Outcomes
E-9. In Situ Bioremediation and Soil Vapor Extraction at the Former Beaches Laundry & Cleaners
E-10. LNAPL Remediation Combining Mobile Dual Phase Extraction with Concurrent Injection of a Carbon-Based Amendment: Little Mountain Test Facility
E-11. Eastern Surplus Company Superfund Site, Southern Plume: Meddybemps
E-12. Hollingsworth Solderless
E-13. Former Industrial Site Characterization and Remediation in Fractured Rock
E-14. Naval Submarine Base Kings Bay, Site 11
Appendix F. Performance Evaluation & Optimization of In situ Remediation using Amendment Delivery
Appendix G. Optimizing Injection Strategies and In situ Remediation Performance
Glossary
References
Acknowledgments
Team Contacts
Document Feedback


Optimizing Injection Strategies and In situ Remediation Performance
HOME

4 Implementation and Feedback (MONITORING) Optimization

This section addresses site-specific logistical and permitting issues that should be considered before mobilizing to the site as well as during implementation optimization of the remedy to include changes to dose, amendment, and delivery (see Section 1.3). The remedy may be optimized at any stage based on the evaluation of monitoring data.

4.1 Pre-implementation Considerations

Health and safety plans (HASP) and procedures developed during predesign activities should be reviewed and updated prior to field mobilization to protect the health and safety of site workers and the surrounding community. Changes and improvements in safety procedures developed during predesign site characterization, bench testing, and pilot testing should be incorporated before and during optimization of the remedy. In addition to drilling and subsurface utility hazards, in situ remediation also presents some unique health and safety considerations for the injection of reagents and substrates. These include hazards associated with the chemical amendments themselves, application hazards such as increased subsurface pressures or temperatures, reagents surfacing, and post application hazards such as increased byproduct concentrations, metals mobilization, or vapor intrusion (NAVFAC 2013a). Proper engineering controls for these hazards should be identified and included in the HASP (e.g., USEPA Underground Injection Control Regulations)

Pre-implementation considerations also include federal, state, and local regulatory and permitting requirements associated with the implementation and modification of in situ remedies. Inconsistencies between various federal and state programs can present regulatory challenges. As discussed further in Sections 5 and 6, early communication with the relevant regulatory agencies and stakeholders, early start-up on the HASP development, and an understanding of the necessary permitting requirements are critical to facilitate timely regulatory and stakeholder acceptance.

4.2 Adaptive Implementation and Feedback Optimization

Remedy design is an iterative process that unites consideration of site characteristics, amendments, and delivery method. It is important to recognize these truths:

  • The data set for a site upon which to develop a CSM and corresponding design will never be perfect or fully complete.
  • Factors that influence design cross many orders of magnitude in scale, from the molecular to the site-wide level.
  • Site conditions change at time frames that range from minutes to decades.
  • Although our models and designs often assume homogeneity, heterogeneity is the rule.
  • Amendment transport in the subsurface is (to a first order) dependent upon the site geology, hydrogeology, and delivery method, but nonetheless often seems random and chaotic due to the smaller scale heterogeneities.

It is therefore important to integrate mechanisms for process monitoring, feedback, and flexibility during implementation into the remedial design process.

4.3 Implementation and Optimization Staircase

To conceptualize the iterative process, the design wheel and optimization staircase (see Section 3.1) were developed. Note that in some cases, the results of a bench-scale or pilot test may lead to another bench-scale and/or pilot test before moving into full scale. Optimization is not meant to create an endless cycle of testing and project delays, but to create a remediation strategy that is cost-effective and efficient by targeting the contaminants in the most effective manner. Once the project goes to full scale, this approach is commonly used for subsequent planned injection events, and the monitoring data dictate where and when the next injections will be needed. This approach may not be critical for small, well-understood plumes, but can save millions of dollars and decades of time when the optimization staircase is applied to large, complex plumes (see Section 2.1). At all stages of data collection, consider the cost of collecting analytical data versus the benefit. Also consider the implications of not collecting data, which could result in long-term cost avoidance if properly evaluated.

Within the staircase, there are opportunities to make minimal adjustments to the full-scale remedy. These may be minor adjustments to the remedy that require the practitioner to step back to the pilot study (or bench-scale position if the change is recommended during the pilot study) or make major changes to the remedy that also require return to the bench-scale test. Such decisions are based on a review of the monitoring data and professional judgement. Minimal changes include changes to volume of amendment added, changes in the number of injection points, increasing or decreasing amendment dilution, addition of buffers or bioaugmentation of bioremediation systems, or change in the activator for chemical remedies. Although these changes are considered minimal, some states will require updates to the underground injection control (UIC) permit. Changes that include alterations to the amendment for which stepping back to additional pilot testing is required will likely result in a change to the UIC permit. Major changes, such as moving from bioremediation to chemical oxidation or chemical reduction, may require additional bench-scale testing and may require changes to the decision documents.

4.4 Monitoring

For the purposes of this document, monitoring involves process monitoring and performance monitoring. Multiple lines of evidence are helpful to sufficiently demonstrate that in situ remedies are functioning as designed (Section 4.4.2.3). Therefore, both process and performance monitoring are critical.

  • Process monitoring provides an understanding of the operation of the system prior to injection (aboveground), and the postinjection hydraulics, and/or the immediate chemical effect (underground). It also includes the collection and interpretation of monitoring data that provide information on the state of the remedial action during implementation.
  • Performance monitoring relates to the collection of monitoring data that provide information on the potential success of the remedial action to achieve remedial goals. It also includes compliance monitoring.

A process and performance monitoring program may involve collection of similar data, and these monitoring plans may be grouped into a single document at some sites; however, the timing of data collection events and the actions taken as a result of the data obtained differ.

4.4.1 Process Monitoring

▼Read more

Process monitoring for start-up activities typically involves confirmation that pumps, mixers, blowers, compressors, and other mechanical equipment are operating within the expected ranges as each is exercised for the first-time during operation. (System shakedown is assumed to already have been performed to troubleshoot construction issues, and all equipment should be able to operate as designed at this stage.) If amendment mixing is part of the operation, the volumes of water and materials to be mixed should be confirmed through both measurements and estimates of flows or material quantities. Dosage pumps, flow meters, and flow totalizers are often used to control and measure amendment dose. Direct measurement of amendment concentration using field kits, which is verified by samples collected for laboratory analysis, provide further monitoring of the process.

Monitoring of injection hydraulics includes measurement of flow rates and pressures and may include evaluation of changes in groundwater elevation across an injection network and the observation of tracers, or amendments, at observation wells within or at the fringes of the TTZ to confirm hydraulic performance. If a significant number of monitoring points will be used, or monitoring will extend over a significant period, data logging devices or telemetry may be used to capture and preserve the data for further analysis. Groundwater chemistry effects may include changes in pH and other geochemical conditions, the arrival of amendment at a monitoring point at a desired concentration, or evidence of the intended reactions or secondary affects to be avoided, such as mobilization of chemicals of concern or increased metals solubility.

The data collected should be benchmarked against design and cost estimate assumptions to confirm that the target area was influenced, the emplacement of amendments occurred at the target concentrations, the geochemical effects needed to facilitate treatment (such as pH modification) were achieved to the extent needed, the timing of injection was consistent with expectations at the flow rates and pressures observed, and systems used to perform treatment operated as expected. If these fundamental objectives were not achieved, modification to the treatment approach, system design or operation, volumes of amendment, concentrations of amendment, or other factors may be needed.

4.4.1.1 Process Monitoring Design Considerations

▼Read more

Process monitoring of in situ remediation at pilot- and full scale represents a set of activities that must be carefully planned, designed, and executed to help ensure desirable contaminant reduction or stabilization outcomes in the face of complexity and uncertainty commonly associated with the subsurface stratigraphy, contaminant presence, contaminant migration, and remedial performance. In the context of this guidance, process monitoring is defined as the observation and documentation of remedial equipment performance used to affect changes and subsequent response of the TTZ and surroundings. Perturbation of the TTZ pore pressure, temperature, fluid viscosity, geochemistry and microbial populations, and changes to solid surfaces biogeochemistry, effective stress, permeability, and other basic and derivative properties and features can be anticipated by the act of injecting fluids and emplacing solids (colloids, particles in slurry form), collectively referred to as amendment.

The design for process monitoring should seek to address key features and questions concerning the specific remedial technology that is to be piloted or deployed at full scale and the site-specific subsurface hydrogeology, geology, biogeochemistry, and contaminant distribution and fate under natural and induced conditions. Additionally, project constraints related to budget, schedule, resource limitations, and safety must be observed to arrive at a process monitoring design that is balanced technically and otherwise. Sources of information that could represent starting inputs to the design of process monitoring programs include the RDC, analytic and numerical modeling, treatment amendment vendor-supplied information, bench-scale treatability testing, and results from field and laboratory testing recently performed to fill pressing data gaps not yet integrated into the RDC. Information from other sites of a similar nature to the subject site can be valuable. Numerous public and private guidance documents are available that provide best practices and other information that can assist in design of an effective process monitoring program (NJDEP 2017; USEPA 2018b); (Neilsen 1991).

Within the design stage, basic details and options associated with process monitoring, as well as performance assessment monitoring, should be outlined in a preliminary manner when the core attributes of the remedial technology application have been defined. Attributes of process monitoring that are typically considered, and often specified, during the design process for injection-based groundwater treatment remedial approaches are listed below:

  • baseline (see Section 4.4.2.3) aqueous geochemistry and/or microbial population characteristics within the TTZ and upgradient and, potentially, side-gradient (background)
  • baseline biogeochemical characteristics of the sediment/soil or bedrock within the TTZ (background)
  • amendment quality assurance characteristics, e.g. pH, DO, ORP, viscosity, constituent concentration, particle size, stability/variability of liquid mixtures (e.g. ZVI and EVO, other parameters) at time of materials delivery acceptance, mixing preparations, and/or subsequent storage prior to use
  • injection pressure and flow rate at critical location(s) within mixing and injection equipment subsystems such as at manifold locations, pressure relief valves, and individual injection borings or wellheads
  • total volume of amendment delivered to individual boreholes or wells. Note that flow meters are usually accurate +/–3% and must be positioned per manufacturers’ recommendations within the injection system. Also, if magnetic flow meters are not used for solids flow measurement, the accuracy of measuring volume reduction in feed tanks should be considered.
  • subsurface hydraulic response to injection (e.g. tilt meters or surveyed ground surface elevation changes), including intentional and inadvertent formation fracturing and subsequent emplacement of solid treatment amendments and permeability enhancement components (propping agents)
  • subsurface volume within which aqueous- and/or solid-phase biogeochemistry is altered by direct and indirect action of injection
  • specific chemical, physical, and microbial responses (e.g. pH, DO, ORP, TOC, sulfate reduction) within and around the TTZ that, taken individually or in unison, provide lines of evidence for assessing the degree of success or failure in achieving desired injectate amendment constituent (or injectate amendment constituent byproduct) reactions and, by extension, COC treatment outcomes.

Prior to mobilizing for pilot- or full-scale implementation, baseline conditions in and around the TTZ are established to provide a context for interpreting the process monitoring data. Proper documentation and timely interpretation of the process monitoring data, and its subsequent use, are critical aspects of optimization. The data obtained from the process monitoring effort can be divided into two categories, one being physical responses and the other chemical/biogeochemical responses. With respect to the latter, focusing on chemical and biogeochemical changes helps to verify that in situ treatment is developing or progressing as intended (or not). Specific questions that are addressable with an effective process monitoring program include:

Where did the amendment go? Soil borings, discreet groundwater samples, or EC logging may be necessary to identify the ROI of certain amendments.

  • Are (or did) the injectate amendment constituents performing their intended role?
  • What are the immediate chemical/biogeochemical and COC response trends?
  • Are physical changes, such as permeability reduction or increase, occurring that provide clues as to chemical/biogeochemical response?
  • Are there indications of problems or unexpected outcomes now or forthcoming?
  • Are there opportunities for optimization of the treatment details, process monitoring, or both?

Ultimately, it is necessary to assess not only the short-term effectiveness of the implementation but also the longer term practicality of the strategy and technology being applied. If short-term effectiveness appears to be lagging, are there discrete optimization activities that can put the remedial action on the desired path? Is a more dramatic change in technology, such as amendment delivery technology, warranted by the process monitoring data? Refer to the optimization staircase (see to Section 3.1) as these questions are asked and answered.

4.4.1.2 Process Monitoring Implementation

▼Read more

The process monitoring stage should focus on collecting data to confirm that the amendments are introduced and distributed according to the design, and that the application method is appropriate. The types of questions that a practitioner should be asking when reviewing the process monitoring data include:

  • Are injection pressures and flow rates consistent with design expectations? If pressures and flow rates are very different than expected this may indicate that the subsurface geology is different than that for which the system was designed.
  • Is the amendment being delivered where and how it was designed to be distributed?
  • Is the design volume of amendments injected as expected at all locations? What is the strategy for locations or intervals that were lower or missed altogether?
  • Are unusual results (for example, indicator parameters/analyses, water level changes, etc.) occurring at nearby monitoring wells?
  • Is daylighting or breakthrough observed at utility corridors, drainage channels, surface water features, or monitoring wells that are far from the injection area where breakthrough was not expected?
  • Do the indicator parameters support that chemical or biological reactions are occurring as expected? For example, were unusual temperature changes, pH, ORP, DO, vapors, color changes, or other physical changes observed during injection?
  • If data are not as expected, are corrections possible during the ongoing field event? What is the communication plan for reporting results in real-time and who is the decision maker for implementing changes? (see Section 4.6.2 for additional discussion of contingency plans)
4.4.1.3 Process Optimization

Process monitoring data should be evaluated in real time, or as close to real time as possible to allow in-field adjustments (optimization) to be made. Because of the real-time aspect of process monitoring, it is essential that experienced field staff be involved in the implementation of the process monitoring plan, and that all staff involved in the remedy implementation are appropriately trained and are aware of the remedy objectives, expected results, and triggers for actions. A comprehensive work plan or field implementation plan should anticipate potential complications in the field and provide a contingency for likely scenarios.

A formal, centralized process should be established to manage and communicate changes made to the original implementation plan as a result of the process monitoring data. Suggestions for this communication pathway are given in (ITRC 2011d). Changes should not be made in isolation, as a change in one area of the implementation methodology may have follow-on effects. The potential impact of that change on future process monitoring data evaluations should be considered and incorporated throughout the optimization process (see Section 4.3).

Table 4-1 provides some examples of observations that may be made during the course of process monitoring, and potential implications. Table 4-1 should not be considered an exhaustive list and there are many site-specific factors that contribute to interpretation of the data. This table represents a few common observations and potential failure mechanisms to be aware of.

Table 4-1 ▼Read more

Table 4-1. Typical observations during process monitoring.

Data Type Scenario Potential Implication
Water Level Water levels at nearby monitoring wells (e.g., 3 m) show a significant increase with very little fluid injected into the injection well location. This type of result may indicate a connection or preferential pathway. Be aware of the potential for daylighting and for amendment distribution challenges.
Pressure Injection pressures are higher than expected. Tight soils or biofouling (Section 3.6.1.2) may be causing blockage. High pressures may result in fracturing or daylighting. Biofouling or scaling may block injection lines or well screens. A lower permeability than expected may require change in design, as it will result in a smaller than anticipated ROI.
Injection pressures are lower than expected. This may indicate leaks in lines, or malfunctioning gauges. A higher permeability than expected may require change in design.
Injection pressures suddenly drop and flow rate increases. A preferential pathway (Section 3.6.1), fracture, or utility corridor may have been intercepted or an injection pressure fracture may have been created.
Physical Parameters Conductivity, temperature, turbidity, or other indicator parameter of amendment (e.g., TOC or color) is observed at a nearby monitoring well (e.g., 3 m) at a lower than planned injection volume. This type of result may indicate a connection or preferential pathway between wells. It may also indicate a higher K area of the site, resulting in a larger than anticipated fractured flow.
Vapors, an unusual odor, or a change in color is observed at a monitoring well. Unexpected reactions may be occurring either in the formation or with an adjacent sewer line. Injection into nonaqueous phase liquids (NAPL) may have occurred.
Changes in conductivity, temperature, turbidity, or other indicator parameter of amendment (e.g., TOC or color) is not observed at an expected monitoring well, or is observed only at low levels. Preferential pathways (Section 3.6.1) may be present, or an insufficient volume of fluid has been added to achieve the target distribution. Re-evaluate the expected injected volume to distribution relationship calculations and confirm that suitable volumes were added.
Conductivity, temperature, turbidity, or other indicator parameter of amendment (e.g., TOC or color) is observed at a deeper interval than the injection interval. Consider density-driven flow or preferential pathways (Section 3.6.1) that may be hindering the achievement of contact between amendment and targeted treatment interval.
Observations in Soil or Bedrock Cores Presence or lack of presence of amendment in offset cores. Injected slurries or proppants typically may have a smaller ROI in coarse-grained formations and larger ROI in fine-grained formations as a result of soil fracturing. Revise injection volume based on effective porosity of the formation. Jetting may be required in coarse-grained soils. Cores are only a small area of the total ROI, so this could be just a sampling issue. Otherwise re-evaluate overall delivery approach or use other less targeted technologies to assess distribution or just rely on monitoring well impacts.


4.4.2 Performance Monitoring

▼Read more

Once the appropriate amendment and delivery technique for a site’s unique conditions have been optimized, a performance monitoring strategy must be developed to assess performance and regulatory compliance during application, remedy operation, and post operation periods. This section describes performance and compliance monitoring configurations, decision parameters, optimization alternatives, contingency planning, and remedy transition planning. Performance monitoring includes techniques to assess field application of amendments, post application performance, and the overall long-term effects of the remedy. Note that both short-term and long-term performance monitoring should be reviewed to evaluate seasonal patterns, temporal changes, back-diffusion, and evidence that the site may not have been adequately characterized.

This section also presents optimization techniques that can be implemented during subsequent application events. Furthermore, this section includes a discussion of when remediation should be transitioned, whether to an alternative technology, MNA, or closure. Information in this section supports development of a site-specific plan; therefore, not all optimization activities are applicable to every site.

The intent of performance monitoring is to evaluate remedial progress upon successful injection and distribution of amendments. Performance monitoring compares conditions before, during, and after treatment using various performance indicators and metrics to determine a site’s status. Some possibilities include:

  • Progress toward remedial performance objectives (ITRC 2011c) is acceptable and objectives are being met.
  • Total contaminant mass has been destroyed (see Section 4.4.5.2).
  • Remedy optimization can meet objectives with greater efficiency.
  • Performance is unacceptable and the remedy and supporting data must be re-evaluated.

A performance indicator should be defined in terms of the technology being used, targeted media, receptor location, and expected response of the subsurface to treatment by the technology. Typically and historically, a performance indicator is the contaminant concentration. However, other performance indicators may provide information regarding the mechanisms responsible for decreases in contaminant concentration such as mass flux to demonstrate source control, NAPL depletion rate, biodegradation rate, chemical oxidation/reduction rate.

Development of an effective performance monitoring strategy requires consideration of different factors, including:

  • overall site remediation goals and objectives (ITRC 2011c) (e.g. plume containment, plume stability, mass flux reduction, mass decrease, attaining maximum contaminant limits (MCLs), or other performance standards)
  • translation of overall remediation goals into remedial system

Performance objectives: ▼Read more

Performance objectives include specific measures used to determine whether or not the remedial action is successful in achieving site-related remedial goals or interim remedial milestones. Remedial performance objectives typically are site- and technology-specific, and based on the site-related remedial goals. They also vary depending on the type of contaminant being remediated (e.g. chlorinated volatile organics, petroleum hydrocarbons, metals, PCBs). When developing remedial system performance objectives, the practitioner should consider how the data will be used to evaluate progress, guide optimization, and demonstrate achievement of site remedial goals.

Performance indicators: ▼Read more

A performance indicator is a measurable or calculable feature of a remedial system or process that provides direct interpretive value to (1) remedial mechanisms or processes or (2) achievement of a remedial objective. A performance indicator should be defined in terms of the technology being used, targeted media, receptor location, and expected response of the subsurface to treatment by the technology. Typically and historically, a performance indicator is the contaminant concentration. However, other performance indicators may provide information regarding the mechanisms responsible for decreases in contaminant concentration (for example, percent of groundwater plume capture to demonstrate plume containment, mass flux to demonstrate source control, NAPL depletion rate, biodegradation rate).

Performance metrics: ▼Read more

A metric is a unit of measure; therefore, a performance metric is the unit of measure for a performance indicator.

Performance models: ▼Read more

A performance model is a predictive model that describes the expected course of the remediation process. It describes graphically and/or numerically how conditions are expected to change over time, as measured using appropriate performance indicators, from the current state until the performance objective is achieved. At many sites and for many remedial systems, no single performance model, indicator, and metric is likely to be adequate for assessing remedial performance; thus, conjunctive use of multiple metrics may be needed to evaluate performance.

The performance monitoring strategy should be directly related to the following factors.

  • Site and TTZ characteristics, remedial design characterization, and associated CSM, at a resolution and scale(s) applicable to the treatment technology.
  • expected behavior of the treatment system under optimal conditions
  • common or reasonably anticipated shortcomings in treatment system operation
  • common or reasonably anticipated shortcomings in treatment effectiveness
  • expected time frame for attaining performance objectives
  • compliance objectives

Often, it is useful to implement a data quality objectives (DQO) process to develop and document the technical rationale for a performance monitoring strategy (USEPA 2006a).

Because remedies at many groundwater contamination sites require a long time to achieve completion, performance indicators and metrics specific to interim remedies and goals can be helpful in evaluating progress toward ultimate site closure. Performance indicators and metrics should address:

  • remedy operation (e.g. injection rate, ROI, beginning COC concentrations, concentration trends, amendment application rate) (see Section 4.4.1)
  • remedy progress (e.g. rates of reduction of contaminant volume and/or mass, COC trends, microbial populations)
  • remedial goal attainment (e.g. individual well COC concentration mean and confidence levels, individual well COC trends, overall COC trends, or alternatively, remediation goals based on contaminant flux and/or mass reduction rather than concentration-based goals)
  • compliance with specified regulatory metrics

Identification of multiple performance indicators and metrics, consistent with technical approaches based on multiple lines of evidence, typically strengthens the data and information used to support decision-making throughout the remedy implementation process.

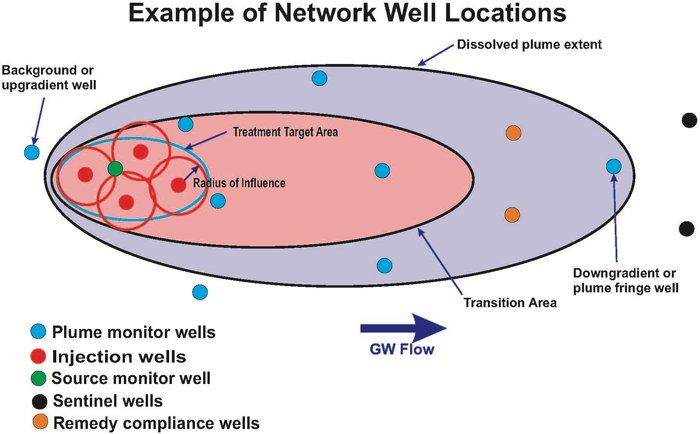
4.4.2.1 Monitoring Well Network

▼Read more

Monitoring points used to monitor the performance of an in situ remedial action in meeting final remedial goals should ideally be located outside the designed area of influence for those injection units and be positioned to assess whether the remedial action is addressing the entire targeted contaminant plume. Several conditions can affect the representativeness of groundwater collected from injection wells and lead to uncertainty or overestimation of remedy performance:

  • Data collected from injection wells, which are by definition located within the ROI could be misleading and exaggerate treatment performance.
  • Amendments will likely accumulate in or near the injection well.
  • Injection wells are susceptible to scaling and biofouling (see Section 3.6.1.2), depending on the natural geochemistry and amendments injected.
  • Displacement of representative contaminated groundwater from the screened interval can occur due to injection of large volumes of amendment.
  • Anisotropic distribution of amendments can occur due to heterogeneous geology or uncontrolled hydraulic fracturing.
  • Thermal reactions within the ROI of the injectate may cause volatilization of some contaminants and may mobilize others.

It is useful to categorize the monitoring strategy individually within portions of the site or the TTZ. The monitoring strategy can be tailored specifically to the regulatory, operations, and optimization needs of each category. Examples of useful ways to subdivide a site or TTZ may include:

  • background area
  • source area
  • NAPL zone
  • contaminant plume
  • plume fringe areas
  • amendment TTZ
  • contaminant reaction/treatment area
  • geochemical transition zones
  • compliance boundary

Background wells, source area monitoring wells, plume area and plume fringe monitoring wells, sentinel wells, and compliance boundary wells are typically included in the performance monitoring network (Figure 4-1) (2011c).


Figure 4-1. Example of network well locations

Within the treatment area monitoring wells should be used to assess performance. If the design assumes source reduction that will minimize flux leaving the source then additional monitoring wells would be outside the treatment area. The distance of monitoring wells from the injection wells will be dependent on site geology and the volume, rate, and pressure of amendments being injected. The number and spacing of monitoring locations should be a direct reflection of the complexity and heterogeneity of the TTZ. In complex hydrogeologic settings, performance monitoring may require wells in transects that are perpendicular to groundwater flow direction to monitor lateral components of the plume and to evaluate mass discharge. Intermediate and/or deep wells may be necessary to evaluate the vertical extent of the plume.

The monitoring program and network should also provide data that characterize changes within the geochemical transition zones. Changes in groundwater geochemistry within the treatment zone are an intended and necessary component of in situ treatment and are important performance indicators. These changes and associated secondary water quality effects may also extend beyond the treatment area and persist longer than the treatment time frame before typically returning to pretreatment conditions. Monitoring of geochemical transition zones may be important in an area beyond (i.e. downgradient of) the treatment zone and persist over a different time frame than monitoring focused on contaminant treatment.

Other questions to consider in developing a performance monitoring strategy include:

  • Is the spatial distribution of monitoring points sufficient to map?
  • Are the actual biogeochemical zones associated with treatment?
  • What are the hydrodynamics within the treated area?
  • Are there changes in treatment process parameters along flow paths?
  • Are the monitoring wells inadvertently creating a preferential pathway for amendments?
  • Are new performance monitoring wells needed to evaluate groundwater quality?
  • What is the variability within the treatment area?
  • Is the chemical analyte list sufficient to monitor and optimize?
  • What is the actual treatment process?
  • What is the metric for assessing remedy effectiveness?
  • Are there secondary geochemical and water quality effects?
  • Is sampling frequency and duration sufficient to:
    • ensure that the longevity and effectiveness of the amendments are taken into consideration?
    • optimize treatment operation after start-up?
    • monitor treatment process and performance in response to seasonal/annual change (for example, hydrodynamics, plume dynamics, treatment substrate availability)?
    • provide information in a timely manner to allow modifications and prevent noncompliance?

Performance monitoring is a critical step in assessing the efficacy of an in situ remedy, encompassing both data collection during (process monitoring) and after remedy implementation (remedial effectiveness monitoring). The subsections that follow discuss the elements of an appropriate monitoring program from baseline through compliance monitoring and focus on the evaluation of data to optimize performance of in situ remedies.

4.4.2.2 Monitoring Schedule

▼Read more

Monitoring frequency may vary throughout the long-term monitoring program. It is common to initially begin with a relatively frequent monitoring schedule, which may then be modified, as site conditions are better understood. Projects with regular performance monitoring and evaluation of the results have a greater chance of achieving the remedial goals within desired time frames and potentially at a lower cost (USEPA 2017b).

The frequency of monitoring is dependent upon the type of amendment injected, anticipated rate of reaction, the groundwater flow velocity, distance to potential receptors, and the rate of change of key analytes (for example, primary contaminants and daughter products/intermediates). Longevity and effectiveness of the amendments play an important role in selecting initial to long-term sampling frequencies. For treatment technologies with fast kinetics (for example, abiotic-based treatment projects) the initial sampling frequency may start out hourly or daily until process monitoring parameters are stable (see Section 4.4.1) and then transition to quarterly, semiannual, or annual sampling. For treatment technologies with slower kinetics (enhanced bioremediation), process monitoring parameters may be measured weekly while microbial consortia and COCs and final degradation products may be sampled quarterly, semiannually, or annually. If the groundwater velocity is relatively fast, frequent sampling may be necessary to evaluate the treatment system such that optimization is initiated in a timely manner. Conversely, in aquifers where the velocity is slow, sampling more than semi-annually may be a waste of resources and provide unchanging data of limited value. Important information can be missed if the initial sampling is not executed soon after, or frequently enough following, implementation. However, it is very likely that once certain interim criteria are met, monitoring can be transitioned into a more cost-effective, less frequent (and in many cases fewer parameters) long-term plan (NAVFAC 2018).

The monitoring frequency should be sufficient to identify (as quickly as possible) when the implemented remedy is not performing as expected and requires potential modification (for example, reinjection of amendment(s), bioaugmentation, pH adjustment). Monitoring frequency and duration should illustrate that back-diffusion from matrix storage will not jeopardize long-term remedial objectives.

As a cost-savings and time-savings measure, analytical parameters that are inexpensive and quickly obtained are typically monitored more frequently during early performance monitoring. More complex analyses are recommended for long-term performance monitoring. For instance, establishment of microbial populations necessary to support bioremediation occurs more slowly than ISCO reactions, and therefore microbial analyses are not conducted immediately or with great frequency. However, it is necessary to assess whether ideal conditions to support microbial activity are being established. These water quality conditions are typically evaluated through low-cost analyses such as DO, ORP, and TOC on a frequent basis. Once the ideal water quality conditions are established, then it would be appropriate to evaluate changes to microbial community populations.

4.4.2.3 Baseline Monitoring

▼Read more

Developing an effective baseline monitoring plan to evaluate progress toward achieving remedial objectives is a critical element of an in situ remedial action (ITRC 2005, 2011c; NJDEP 2017). Baseline conditions should be established prior to the initiation of remediation either by using historical soil or groundwater quality data and/or by conducting one or more separate baseline sampling events. Ideally, historical data should provide seasonal and temporal trends. Baseline data should be collected within 6 months of the design phase, particularly if site conditions are changing rapidly due to high groundwater velocity, extreme weather events (for example, recent hurricanes, flooding, drought), or activities that might impact site conditions (for example, new industrial or municipal water supply well, excavation, or heavy construction). If a post-remedial design baseline sampling event is performed, it should be conducted to allow sufficient time for the results to be evaluated prior to the initiation of remediation. Baseline monitoring also establishes pretreatment conditions for comparison with data collected during and following in situ treatment to assess the effectiveness and protectiveness of in situ remedial technologies.

Baseline analytical parameters will differ depending on the COCs targeted and the amendment(s) selected for in situ remediation. Section 4.4.4 list the general parameters to be analyzed during baseline monitoring and the subsequent stages of early and long-term performance monitoring and compliance monitoring. Use professional judgement to determine the frequency of sampling each parameter as appropriate for the amendment selected, as the analyses mentioned are not exclusive or exhaustive. The vendor providing the amendment is also a good resource for establishing a sampling and analysis plan.

Establishing baseline conditions includes the analysis of soil and groundwater samples from the site for target contaminant(s), potential biological or abiotic degradation byproducts, general geochemistry, co-contaminants that may not be affected by the selected amendment or that may interfere with the in situ remediation process, and naturally occurring constituents or geochemistry that may interfere with the in situ remediation process. This may include high resolution profiling techniques. It may also include parameters that are naturally occurring and unique to the amendment such as sodium or potassium. Although baseline monitoring of soil conditions is an important criterion for many remediation sites, performance monitoring is generally performed through the evaluation of groundwater data because it is less costly to collect and more homogeneous than soil. The baseline sampling event should be conducted at the same locations as the proposed remediation monitoring locations, which should include an upgradient background, plume source, midplume, plume fringe, and sentinel wells as illustrated in Section 4.4.2.1. If background contamination is present on-site from off-site sources, additional sampling of background monitoring wells may be warranted.

Groundwater sampling parameters should include the chemical constituents in the amendment to be injected (for example, for compatibility testing) and any constituents that may cause groundwater quality to exceed a numeric groundwater or surface water criterion (for example, sulfate in a sodium persulfate application). Comparison of baseline and post-treatment sampling results may indicate the criteria were exceeded due to natural conditions, or pretreatment conditions. Natural or background conditions could potentially be determined from nearby, unaffected or upgradient wells if insufficient preinjection data are available.

In certain cases, the monitoring plan should include sampling of other media as necessary to address risks to all potentially affected media (for example, surface water, groundwater, soil, soil vapor, indoor air). Planning should consider possible physical displacement of any subsurface contaminants by the amendment injections (in any phase or media), as well as technology-specific impacts (for example, the physical displacement of light non-aqueous phase liquid (LNAPL) or vapors, which may subsequently cause or exacerbate vapor intrusion into a nearby building) or transfer of contaminants and amendments from one medium to another.

4.4.2.4 Compliance Monitoring

▼Read more

Compliance monitoring is performed to assess whether the remedy has been successful in meeting the interim or final regulatory goals established and if other compliance metrics are being met. An example of a compliance metric is an allowed increase in TDS of 20% above background, but not exceeding the water quality standard for TDS. Compliance monitoring is typically performed at the edge of the plume; immediately upgradient of a stream or other protected resource; at the property line; or for certain Resource Conservation and Recovery Act (RCRA) and non-RCRA landfills, impoundments and similar projects, at the point of compliance for a regulated unit. Injection wells are subject to a variety of issues that limit their usefulness in performance monitoring and prohibit their use for compliance monitoring in all but the most extenuating circumstances.

Referring back to Section 4.4.2.1 compliance monitoring wells are likely to be sentinel wells, plume fringe wells, or downgradient plume monitoring wells, depending on the interim compliance standard the remedy is expected to achieve. The parameters monitored at the compliance point include, at a minimum, field parameters (for example, pH, specific conductance, temperature, turbidity, DO, and ORP), site-specific COCs, and any indicator parameters applicable to the amendments injected. For instance, an increase in dissolved arsenic concentration is a common side effect of anaerobic bioremediation. It is important to monitor arsenic to determine if remediation efforts have mobilized and threaten water quality at the point of compliance, property line, or other predetermined compliance monitoring point. Other examples are provided in Tables 2-3 and 4-2 through 4-6.

Depending on the (see Section 5) where the project is located, there may be additional monitoring requirements for compliance purposes. Most states require permits for the injection of amendments into the subsurface, typically called UIC permits. These permits may have various compliance metrics that must be met. The UIC permit may require additional monitoring wells and specific compliance monitoring parameters.

As an example, in 2008 and updated in 2015, the California Central Valley Regional Water Quality Control Board (CCVRWQCB 2015) developed a general order (similar to a permit) for in situ cleanup projects. That order provides information requirements for the proponent to provide to be covered under the order. Some of the information required includes a proposed monitoring plan to assess the water quality impacts from the project, delineation of compliance points and transition points, and a contingency plan with trigger metrics for implementation. The order and accompanying Notice of Applicability include water quality objectives that must be met, groundwater quality limitations and specifications, and discharge prohibitions. The design, monitoring, and optimization of the project can be affected by complying with the order. There is also a working group at the Los Angeles RWQCB that issued technical guidance in 2008, “Subsurface injection of ISRR” (LARWQB 2008).

Another example exists in the Eastern Surplus Company Superfund Site, Southern Plume, Maine Department of Environmental Protection (USEPA 2018a). After discovering contaminated groundwater in two separate plumes (northern and southern plumes), remedial actions for a combined groundwater pump and treat and ISCO were begun at both plumes. VOC contaminant concentrations within the southern plume have decreased to below concentration goals, which are based on U.S. Environmental Protection Agency (USEPA) maximum contaminant levels (MCL) or Maine’s maximum exposure guidelines (MEG), whichever is lower for the COC. USEPA performed a bench-scale study in 2011 and a pilot study in 2012–2013 of EISB in the northern plume. Based on the positive impact, USEPA is preparing to expand to a full-scale implementation of EISB.

Thus, a project proponent needs to obtain the specific requirements for the state where the project is located. These requirements may have profound impacts on the design and optimization of the in situ remedy project.

4.4.3 General Parameters

Parameter selection depends on the type of in situ technologies applied. Some general baseline parameters common to various in situ methods are evaluated to measure the effect of in situ remediation relative to remedial objectives, compliance criteria, or operational end points. These parameters may be collected in any and/or all media:

  • NAPL— ▼Read more
    Observations for the presence of NAPL should also be made and the potential for NAPL mobilization assessed. NAPL thickness or other quantity and extent estimates based on ratios between concentrations and compound solubility can be made along with groundwater monitoring. Complexities and uncertainties in the methods used to evaluate the presence of NAPL and progress and effectiveness of NAPL recovery can influence the understanding of NAPL importance in remedy performance. Several techniques for NAPL evaluation should be used to establish multiple lines of evidence to guide decision-making. Apparent NAPL presence and thickness can be dependent on groundwater elevations relative to NAPL deposits in the soil matrix and monitoring well screen construction. Seasonal or long-term variation in water levels at a magnitude that is significant relative to the elevation of NAPL entrained in the soil matrix and/or well screen elevations may result in variation in NAPL observation, mobility, and influence on dissolved phase concentrations and remedy effectiveness.
  • Vapor— ▼Read more
    Photo ionization detector (PID) headspace measurements from monitoring, injection, or vapor wells can be used as semiquantitative data on VOC concentration trends. Vapor measurements can also be used to evaluate whether vapor intrusion risk would be increased by the in situ technology and monitor potential receptors. This would include an evaluation of human-made conduits (for example, sewer, utilities, and abandoned boreholes) that could be a preferential pathway for contaminant or amendment migration and disrupt treatment. FID headspace or other measures of methane such as lower explosive level (LEL) may be useful in evaluating the potential for methane accumulation in basements or confined entry locations.

Sampling parameters, timing, and frequency should be selected based on how long the injected amendments are expected to be active and effective. Due to the relatively lower cost and ease of collecting groundwater samples, it is common to collect groundwater samples more frequently during a remedial program. Therefore, most of the discussion in this section focuses on groundwater monitoring. However, professional judgement should be used to determine when, where, and how frequently other media should be sampled and how to evaluate that data.

The geochemical, hydrogeologic, and microbial data should be used to characterize both pre-implementation chemical conditions and hydrogeologic conditions (see Section 2.2). Evaluation of chemical, physical, or biological processes in the subsurface that affect remedy performance and the distribution of COCs depends on the media monitored and potential exposure pathways. Subsurface media may include NAPL, aquifer matrix materials, soil gas, groundwater, seeps, and surface water. If feasible, the preinjection degradation rates should be compared to postinjection rates to measure the effectiveness of in situ technology relative to natural attenuation. Some suggested baseline monitoring parameters that may be applicable are listed below and should serve as a starting point for a site-specific parameter list. Based on site-specific conditions and remedial objectives, additional parameters may be warranted as discussed in Section 2.3 and Section 4.4.4. Further information may also be found in the Appendix A fact sheets for various amendments.

Groundwater Elevations: ▼Read more

Groundwater elevations should be monitored to evaluate the hydraulic connection between the injection well locations and monitoring wells. Hydraulic gradient information should be calculated to estimate the most probable contaminant migration direction and velocity. For larger treatment zones or more complex hydrogeology (for example, interactions between the unconsolidated and bedrock aquifers, tidal or seasonal fluctuations in groundwater, karst, etc.), transducers with data loggers would provide additional information and better capture variability over time. If differences in static water levels during process monitoring are not consistent with expectations, or if a shift in hydraulic gradient or preferential pathways is noted, then additional assessment may be warranted.

Tracers: ▼Read more

Groundwater flow direction and preferential pathways that influence the distribution of target contaminants and injected amendments may not be apparent from groundwater elevations and gradients. It can be useful to evaluate site hydrogeology using tracers such as dyes, temperature-controlled water, deionized water, deuterium -which may require special permits, ionic salts, or stable isotopes specifically emplaced with amendments or by using the parent amendments (e.g. TOC, DO, sulfates) or reaction byproducts such as methane. Compounds that degrade, transform, or partition out of the dissolved phase may or may not be useful qualitatively as tracers. Tracer data may be used for quantitative evaluation of distribution, velocity, and remediation time frame (Shook 2004).

Field and Water Quality Parameter Measurement: ▼Read more

Common field parameters include pH, DO, ORP, temperature, turbidity, and specific conductance (see Section 2.2). Most in situ injection strategies will alter these parameters by design. Establishing a baseline and then monitoring over time following amendment injection(s) will inform the effectiveness and duration of treatment. For larger treatment zones or more complex hydrogeology (for example, interactions between the unconsolidated and bedrock aquifers), data loggers would provide additional information and better capture variability over time. Data loggers that measure temperature or specific conductivity as well as pressure may be useful. Field measurement of ferrous iron may also be appropriate for some sites, particularly those involving anaerobic bioremediation.

General Geochemistry: ▼Read more

Parameters may include nitrate and nitrite nitrogen, ammonia, total and dissolved iron, total and dissolved manganese, sulfate, sulfide, chloride, sodium, potassium, calcium, magnesium, fluoride, hardness (as CaCO3), alkalinity, dissolved carbon dioxide, dissolved methane, TDS, dissolved organic carbon (DOC), TOC, chemical oxidant demand (COD), and biological oxidant demand (BOD). These parameters are important to understanding the natural attenuation mechanisms underway in advance of treatment and the potential success or barriers to success for specific treatment amendments. If relevant, confirm that nutrients (nitrogen and phosphorus) required for the microbial metabolism are present in adequate amounts.

Metals Concentrations: ▼Read more

Total and dissolved metals concentrations such as lead, chromium, arsenic, cadmium, zinc in groundwater should be monitored as needed and relevant to specific treatment technologies, as some in situ technologies may promote temporary mobilization of metals within the treatment zone. Generally, metals mobilization declines with time and distance from the treatment zone as geochemical conditions normalize. Therefore, monitoring outside the treatment zone may confirm metals mobilization is restricted to a limited area. The initial investigation of soil and groundwater (that is, during development of the CSM) should include analysis for arsenic, barium, cadmium, chromium (including hexavalent chromium), copper, iron, lead, manganese, nickel, selenium, and if relevant, beryllium and antimony. The appropriate list of metals and analytes would depend on site conditions and amendments used. Typically, the practitioner will be evaluating the reduction or oxidation of metals. Note that upon completion of the remedial action, it may take several months to years for metals concentration to return to background concentrations. The remedial action plan and decision documents should be written to account for the dissolved metals to persist at concentrations exceeding the goal for a period of time. In cases where the COC is a metal, rebound testing will need to be conducted for several years to verify the remedy was successful at immobilizing metals.

Specific Amendments and Parameters: ▼Read more

Each amendment used to treat soil and groundwater requires delivery and maintenance of those amendments to the targeted treatment area. Concentrations of the parent amendment and/or compounds or other indicators associated with the selected amendment (e.g. TOC, DO) should be monitored to confirm delivery and distribution and to track consumption to evaluate injection frequency, dosage, and quantity.

Contaminants of Concern Analysis: ▼Read more

COCs should be analyzed to measure the degree and extent of treatment in the target area, evaluate rebound following treatment events, evaluate the effectiveness of the treatment at the plume fringe, and optimize the delivery and dosage for future injections. For example, estimates of the baseline total contaminant mass in the subsurface can be used for comparison during process (see section 4.4.1) and performance monitoring (see Section 4.4.2) to assess the overall effectiveness of the remedial approach for the site. The baseline target contaminant concentrations are also used for comparison with concentrations remaining in soil and/or groundwater.

Contaminant Breakdown and End Products: ▼Read more

Intermediary compounds formed during treatment reactions (see Section 2.2) are important indicators of progress and should be monitored throughout implementation to understand treatment effectiveness. In some cases, the only product of remediation will be the end product of the treatment reactions. Measurement of the intermediary and end products of remediation is important to confirm that amendments are not masking or displacing the target compounds and that transformation and destruction are occurring rather than migration and repartitioning. It is also important to evaluate whether or not breakdown products are accumulating, which in biological remedies is an indicator that the process is stalling, possibly because the appropriate genes are not expressed for complete degradation or something is inhibiting complete degradation, and in chemical oxidation remedies is an indicator of unwanted byproducts that require further remediation or of incomplete oxidation of intermediary products. Furthermore, it is important to understand the toxicity, fate, and transport of daughter products and intermediates, as some byproducts are more mobile than the parent compounds.

Compound-Specific Isotopic Analysis (CSIA): ▼Read more

In some cases where dissolved phase analysis of target compounds, breakdown products, and end products do not demonstrate the expected level of degradation, isotopic analysis may be helpful in evaluating treatment performance. If repartitioning of target compounds is a driver of dissolved phase concentrations and intermediary byproducts are not available, shifts in isotopic signature within the target compounds, compared to baseline results, may demonstrate selective and more rapid treatment of molecules containing lighter isotopes. (see Section 2.2)

Microbial Analysis: ▼Read more

(see Section 2.2) In cases where pre-implementation or pilot-scale degradation of target compounds is not evident such that biological processes can be inferred from the presence of intermediary or end products, analysis of the biological community and confirmation of the necessary microorganisms may be required. Microbial analysis can be helpful in the baseline monitoring to confirm feasibility of an approach and to confirm the persistent support of microbial communities through treatment and long-term performance monitoring.

4.4.4 Technology-Specific Parameters

The following tables describe some of the analytical parameters that may be used to monitor the performance of various remedies. Although not meant to be prescriptive or exhaustive, the information in the tables can be used to develop a site-specific monitoring plan. For certain amendments, such as activated carbon-based injectates, the general parameters described in Section 4.4.3 are sufficient. Additional information is available in the amendment-specific fact sheets in Appendix A. The general categories include:

  • anaerobic biostimulation (Table 4-2 and A1.2, A1.3, A1.4, A3.1, A3.2, A3.3)
  • aerobic biostimulation (Table 4-3 and A1.1, A1.2, A1.4, A3.1, A3.2, A3.3)
  • chemical oxidation (Table 4-4 and A2.1, A3.2)
  • chemical reduction (Table 4-5, A2.2, A2.3, A3.2)
  • surfactant and co-solvent flushing (Table 4-6, A2.5)

Table 4-2. Analytical parameters for anaerobic biostimulation (with or without bioaugmentation).

Parameter Interpretation Guidelines Recommendations
Contaminant concentrations Progress is denoted by a reduction of parent COC concentrations and an increase in degradation products; build-up of degradation products could signal stalling. If parent concentrations are declining but degradation products are not produced, there may be an alternate pathway (e.g., abiotic instead of reductive dechlorination).
Contaminant breakdown products Breakdown products should be short-lived and reduce with time if the degradation is continuing to the desired end products. Changes in total molar concentrations of the parent and breakdown products should be assessed to verify full degradation. If undesirable breakdown products continue to increase, then adjustments may be needed to stimulate greater transformation toward the desired end products.
Ultimate end products (e.g., methane, ethene, ethane, chloride, propene) Presence confirms degradation of chlorinated solvents or conditions suitable for sulfate reduction and methanogenesis. If sulfate reduction and methane are not observed and ORP is greater than approximately –120 mV, conditions do not exist for sulfate reduction and methanogenesis that support dechlorination.
Field parameters—pH Microbes typically require neutral pH (optimal range is 6.8–7.5; generally required range is 6.0–8.5). Select microbial consortia that are suited for low pH environments. Amend with sodium bicarbonate, sodium carbonate, or other additives to adjust pH; verify distribution if amendment is unsuccessful.
Field parameters—DO and ORP DO should be <0.5 mg/l and ORP should be negative; if DO and ORP values are conflicting, the treatment zone may not be properly buffered or gases formed by injected materials may be causing instruments to read incorrectly. If high DO or high ORP is observed in pockets, anisotropy may be hindering distribution by lowering the ROI in certain areas. Evaluate injection spacing in these areas to improve coverage. Under neutral pH, denitrification occurs when ORP values are between +50 and –50 mV; sulfate-reducing between –50 and –250 mV, and methanogenesis occurs at –200 to –400 mV.
Field parameters (e.g., temperature, specific conductance) An increase in temperature or specific conductance may indicate injection reagents transport and could be used to evaluate ROI. Each species of bacteria has an optimal range of temperature for growth. Verify that selected consortia meet site characteristics during the selection process because aquifer temperature cannot be changed.
Water level and NAPL thickness Mounding or increased hydraulic gradients can be induced during injection events. NAPL can also be mobilized. Determine groundwater flow direction and the hydraulic connection between injection wells and monitoring wells.
TOC TOC includes both naturally occurring organic carbon (such as humus) and organic carbon contamination, e.g., benzene. TOC values above approximately 50 mg/L indicate carbon levels that, if biologically available, could foster cometabolism. Over time TOC will decline again to pre-remediation levels. This, combined with aquifer flow and transport information, can indicate when the substrate is depleted.
Tracers (e.g., bromide, potassium, TOC) If carbon or nutrients are injected, they can be used as a tracer to evaluate ROI and calculate travel times. TOC is an indicator of donor longevity, and trend analysis should predict when secondary injection is necessary. If tracers are not observed where anticipated, review best practices for emplacement techniques. The sorption of carbon amendments to aquifer material complicates delivery.
Ferrous (Fe+2) and ferric (Fe+3) iron and other site-specific metals The ratio of ferrous (Fe+2) to ferric (Fe+3) provides information on how reducing the groundwater is, the potential for abiotic reductive dechlorination via ferrous iron, and the presence of iron as electron acceptors for biological activity. Under reducing conditions, ferric iron will pick up an electron to become ferrous iron. If the observed ratio is not as expected, this is an indication that ideal conditions have not been established. Ferrous iron values >1 mg/L are indicative of iron reduction in the absence of nitrate.
Reduced or mobilized metals (Mn-2, Cr+6, As+3) Various metals may be naturally present in groundwater based on provenance and mineralogy. These should be assessed on a site-specific basis as part of in situ remediation planning.
Alkalinity Alkalinity should be >20 mg/L or fermentation may cause further decline in pH. Select a buffering agent such as calcium carbonate that improves the alkalinity. Alkalinity needs to be sufficient to allow proper buffering so pH does not drop as a result of acids generated during the fermentation process.
Sulfate/sulfite/sulfide Sulfate concentration <20 mg/l is indicative of sulfate-reducing conditions. Amendment dosing should be designed to reduce high sulfate when present. If hydrogen sulfide is formed, this can be toxic to microbes.
Nitrate/nitrite Nitrate is the first choice for electron acceptor after oxygen is depleted and generates a sequence of byproducts consisting of nitrite ions and gases (nitric oxide, nitrous oxide, and nitrogen). Amendment dosing should be designed to reduce high nitrate when present; nitrite may be observed when nitrate is reduced. Nitrate concentrations <1 mg/L are indicative of denitrification.
Volatile fatty acids (VFAs) (e.g., lactic acid, acetic acid, pyruvic acid, propionic acid, butyric acid) Presence confirms the fermentation of carbon substrates such as EVO and lecithin. If VFAs are not present in an area with high TOC, then fermentation is not occurring. Determine if pH, DO, and ORP need to be adjusted to promote biological activity. If VFAs are present, assess whether the proper microbial consortia are present. Amend if necessary.
Vapor measurements (e.g., PID, USEPA Method TO-15, LEL) High levels of gases are an indicator of both successful bioremediation and potential health and safety or vapor intrusion concerns. Evaluate risk of vapor intrusion and/or dangerous gas levels. Mitigate if necessary. Reduce frequency of injections to control methane. Verify pH has not dropped.
Microbial analysis—gene-specific Section 4.4.3 and 4.4.4.1) Microbial analysis evaluates a wide range of anaerobic and aerobic degraders. Dehalococcoides mccartyi (DHC) and DHC-related strains are known to degrade chlorinated ethenes; DHB (Dehalobacter) strains are known to degrade chlorinated ethanes and methanes; DHG (Dehalogenimonas) strains are known to degrade chlorinated propanes and chlorinated ethenes; vinyl chloride reductase gene is known to convert VC to ethene (commonly referred to as vinyl chloride reductase (VCR) and BAV genes). Evaluate if useful microbes are present or if competing microbes are hindering remediation. Microbial analysis provides quantification of important organisms and functional genes responsible for biodegradation of a group of contaminants and therefore more comprehensive site assessment (ITRC 2011b, c).
Use when degradation of parent COCs and/or daughter products is not discernable and is required. Verify anaerobic microbial populations are present; if not, consider amending.

Table 4-3. Analytical parameters for aerobic biostimulation (with or without bioaugmentation)

Parameter Interpretation Guidelines Recommendations
Contaminant concentrations Progress is denoted by a reduction of parent COC concentrations; byproducts detection may be difficult. Seasonal or water table fluctuations should be taken into consideration. If parent concentrations are declining but degradation products are not produced, may be an alternate pathway. Look for ultimate end products or CSIA data to prove degradation.
Contaminant breakdown products Breakdown products should be short-lived and reduce with time if the degradation is continuing to the desired end products. If undesirable breakdown products continue to increase, then adjustments may be needed to stimulate greater transformation toward the desired end products.
Ultimate end products (e.g., oxygen and CO2 gases, dissolved CO2) Presence confirms aerobic degradation to end products. These end products may quickly dissipate in the vadose zone.
Field parameters (e.g., pH, temperature, specific conductance, DO, ORP) Microbes typically require neutral pH (ideal range is 6.0–8). Adjust pH if necessary.
Field parameters—DO and ORP DO should be >2 mg/l and ORP should be positive. If DO or ORP is outside the recommendation, improve oxygen distribution.
Water level and NAPL thickness Mounding or increased hydraulic gradients can be induced during injection events. NAPL can also be mobilized. Determine groundwater flow direction and the hydraulic connection between injection wells and monitoring wells.
Tracers (e.g., bromide, potassium, TOC) If gas carbon or nutrients are injected, they can be used as a tracer to evaluate ROI and calculate travel times. Elevated nutrients can be an indicator of donor longevity and trend analysis should predict when additional injection is necessary. Observe ROI and travel times.
Water quality parameters (e.g., sulfate/sulfite, nitrate/nitrite, alkalinity, propane, TDS) High TDS can be inhibitory to microbial activity. For aerobic cometabolic bioremediation of CVOCs and 1,4-dioxane, propane may be necessary.
Microbial analysis—gene-specific or QuantArray (Section 4.4.3 and 4.4.4.1) QuantArray evaluates a wide range of aerobic and anaerobic degraders. Evaluate if useful microbes are present or if competing microbes are hindering remediation.
CSIA (Section 4.3 and Section 4.4.4.2) Use when degradation of parent COCs is not discernable and is required. Verify aerobic microbial populations are present; if not, consider amending.

Table 4-4. Analytical parameters for chemical oxidation

Parameter Interpretation guidelines Recommendations
Contaminant concentrations Progress is denoted by a reduction of parent COC concentrations. If COC concentrations are unchanged, evaluate distribution and effectiveness of selected oxidant (e.g., permanganate will not oxidize ethanes).
Contaminant breakdown products Breakdown products should be short-lived and reduce with time if the degradation is continuing to the desired end products. If undesirable breakdown products continue to increase, then adjustments may be needed to stimulate greater transformation toward the desired end products.
Ultimate end products (e.g., acetone, carbon disulfide, carbon dioxide, chloride) Presence confirms degradation. These end products may quickly dissipate in the vadose zone.
Field parameters (e.g., pH, temperature, specific conductance, DO, ORP, pressure, ferrous iron, hydrocarbon gases, LEL, CO2) Certain reactions require low pH (ideal range is 4–6); amend if necessary. In the case of alkaline activation of some oxidants, pH should be confirmed to be above targets, typically in the range of greater than 10.5 and < 12. Adjust pH as necessary. Temperature and conductivity are often elevated during ISCO application and can be used to evaluate ROI during process monitoring.
Water level and NAPL thickness Mounding or increased hydraulic gradients can be induced during injection events. NAPL can also be mobilized. Determine groundwater flow direction and the hydraulic connection between injection well locations and monitoring wells.
Metals (e.g., arsenic, chromium, lead, zinc, and other site-specific or amendment-specific metals) Metals can leach from the geology/soil at concentrations that exceed regulatory standards. Monitor secondary effects of ISCO application.
Natural oxidant demand (NOD) Determine the oxidant demand of the existing biogeochemistry and account for it when calculating the amount of amendment needed. A high NOD may preclude the selection of ISCO as cost-effective. COD, soil oxidant demand (SOD), and total oxidant demand (TOD) are related terms. Evaluate oxidant demand required to overcome properties of the aquifer. This is typically a design parameter not used during performance monitoring. Multiple applications of a chemical oxidant may be required to overcome NOD such that COD can be adequately addressed.
TOC TOC provides a general indication of the amount of oxidant that will be needed, if a soil sample cannot be collected for testing. It is best to rely on NOD, COD, or TOD when using chemical oxidation amendments.
Amendment-specific parameters (e.g., manganese, sulfate, sodium, potassium, ozone), amendment components (H2O2, persulfate, permanganate, ozone) Amendments can be used as a tracer to evaluate ROI and calculate travel times if the reaction with contaminants and soil minerals or organics is accounted for. May need to monitor for components of amendments if there are components that present a water quality concern. Evaluate ROI and travel times.
Water quality parameters—TDS TDS is a measure of the combined organic and inorganic substances in water, primarily minerals and salts. Some states have compliance values for TDS and/or individual salts or minerals.
Sample representativeness Oxidants such as permanganate and persulfate if present in the groundwater samples after collecting for analysis may continue to oxidize the contaminants slowly until analysis. Although storing the sample at 4°C may inhibit the oxidation of contaminants, ascorbic acid or sodium ascorbate, as a preservative, is suggested to neutralize the residual oxidant (USEPA 2012b).

Table 4-5. Analytical parameters for chemical reduction

Parameter Interpretation guidelines Recommendations
Contaminant concentrations Monitor change relative to baseline. If COC concentrations have not been reduced, verify distribution of amendments.
Contaminant breakdown products Breakdown products should be short-lived and reduce with time if the degradation is continuing to the desired end products. If undesirable breakdown products continue to increase, then adjustments may be needed to stimulate greater transformation toward the desired end products.
Secondary water quality impacts (e.g., methyl ethyl ketone and acetone) Concentrations typically attenuate rapidly to background concentrations (Fowler 2011). Baseline concentrations of these contaminants should be established and included in performance monitoring to confirm this expected result.
Field parameters (e.g., pH, temperature, specific conductance, DO, ORP) DO should be <1 mg/l and ORP should be negative; specific conductance should be not be affected by ISCR reagents until the iron is converted to ferric or ferrous forms. High specific conductance may suggest fouling. Evaluate amendment distribution if DO and ORP are not reduced. Under neutral pH, denitrification occurs when ORP values are between +50 and –50 mV; sulfate-reducing between –50 and –250 mV, and methanogenesis occurs at –200 to –400 mV.
Water level and NAPL thickness Mounding or increased hydraulic gradients can be induced during injection events. NAPL can also be mobilized. Determine groundwater flow direction and the hydraulic connection between injection wells and monitoring wells. Extreme mounding/injection pressures in injection wells may indicate scaling, fouling, or improper construction/development.
Water quality parameters—TDS TDS is a measure of the combined organic and inorganic substances in water, primarily minerals and salts. Some states have compliance values for TDS and/or individual salts or minerals.
Metals (e.g., iron, manganese, arsenic, and other site-specific or amendment-specific metals) Reduction process can release dissolved concentrations of iron, manganese, and arsenic into the aquifer above water quality standards. Minimize reduction conditions to the extent practicable while still allowing for desired processes for contaminant reduction.
CSIA (Section 4.3 and Section 4.4.4.2) Degradation of COCs is not discernable and is required (e.g., areas with high concentrations near NAPL). Use CSIA to discern low levels of degradation

Table 4-6. Analytical parameters for surfactant and co-solvent flushing

Parameter Interpretation guidelines Recommendations
Contaminant concentrations Monitor change relative to baseline. Expect contaminant concentrations to rise at least an order of magnitude, if not more, during the flushing operation and within the flushing zone. If this does not happen then there is likely a problem with the flushing action. If COC concentrations have not been reduced following the flushing action, verify distribution of amendments. If dissolved COC concentrations have increased in unexpected areas due to surfactant/co-solvent addition, assess need and options for containment/control or removal.
Amendment breakdown products Some co-solvents and surfactants can transform or be biodegraded to other compounds (e.g., certain alcohols to acetone). Breakdown products should be short-lived and reduce with time, but in some cases may pose an exposure risk or treatment challenge. Appropriately specified shear-thinning fluids will rapidly biodegrade, often to low molecular weight organics and carbon dioxide. Limited dihydrogen and methane production is possible. If undesirable breakdown products continue to increase, then adjustments may be needed to stimulate greater transformation toward the desired end products.
NAPL thickness/distribution The mobilization of NAPL by the amendments would be expected to reduce apparent product thickness in target areas. With effective design and implementation greater than 90–95% NAPL saturation reduction can be expected. If decreases are not observed, adjustments are necessary. Injection may displace NAPL to adjoining areas (laterally or vertically) and lead to increases in NAPL footprint or thickness. NAPL transmissivity can also be estimated, but the change in surface tension of the NAPL due to the amendments may change NAPL transmissivity substantially. If expected reductions in NAPL thickness and distribution are not observed, reassess injection and recovery spacing, delivery method, or amendment dosage. If NAPL appears to be displaced, assess injection locations (e.g., work from outside inward), pressures, and volumes and consider steps to control or remove displaced NAPL.
Water levels Monitor piezometric response to injection as a line of evidence for amendment delivery flow paths, and possible displacement of NAPL. If piezometric responses are not observed as expected, evaluate hydrogeology and revise conceptual model; adjust injection and recovery locations, depths, and pressures. 0
NAPL mass/volume recovery The amount of NAPL recovered indicates fundamental performance of surfactant or co-solvent flushing. NAPL recovery is difficult to accurately quantify due to the amendment/NAPL/water interaction and the likelihood of emulsions. Separation processes can allow better quantification. The amount of product recovered (relative to baseline, if a recovery system was initially in place before the flushing) is assessed to determine if amendments are contacting the NAPL. Depth and location of injection and recovery are adjusted if recovery changes miss expected levels.
Concentration of amendments Anionic and nonionic surfactant and co-solvent concentrations are monitored to assess the flow paths and adequacy of concentrations for optimally mobilizing NAPL through micelle formation. Reassess location, depth, volume, and delivery pressure of amendment injections to establish adequate concentrations of surfactants and other components such as shear-thinning fluid polymer to mobilize NAPL.
Tracers (e.g., methylene blue active substances (MBAS), cobalt thiocyanate active substances (CTAS)) Because other subsurface constituents may react with the MBAS or CTAS, it is important to obtain a preinjection baseline analysis. MBAS mostly picks up anionic surfactants and CTAS mostly nonionic surfactants. Some surfactants cannot be detected by either method. Reassess location, depth, volume, and delivery pressure of amendment injections to establish adequate concentrations of surfactants to mobilize NAPL.

There are many remediation sites where multiple remediation technologies have been or are being pilot tested, deployed sequentially, or deployed simultaneously (by design or otherwise) (Appendix E.10, LNAPL Remediation Combining Mobile Dual Phase Extraction with Concurrent Injection of a Carbon-based Amendment). Because the application of most remediation technology classes involves the temporary or permanent alteration of subsurface conditions, it is appropriate to evaluate the potential impacts the other technologies may have on the effectiveness of the proposed technology. For instance, significant organic carbon increase may exert a significant oxidant load above and beyond NOD. The types of analytical tests used for a site-specific monitoring program will vary depending on the chemicals known or suspected of being used previously (either the contaminant or amendment), the amendments expected to be used in the remedial action, and the local geology and geochemistry.

Molecular diagnostics such as quantifying the abundance of degradative bacteria (Section 4.4.4.1 and Section 4.4.4.2) are often included in the analytical suite to serve as additional lines of evidence to confirm contaminant degradation. Given their expense, however, these analyses are generally included less frequently (or applied at only a subset of wells within the network) than the monitoring of primary COCs and geochemistry. Additional information beyond what is provided below may be found in see “Environmental Molecular Diagnostics—Facts Sheets” (ITRC 2011b).

4.4.4.1 Abundance of Bacterial Groups

▼Read more

Monitoring of target compounds and intermediary and end products during pilot- or full-scale implementation may be sufficient to confirm full degradation of target compounds. However, in some cases additional data regarding the microbial community are necessary to assess feasibility or understand and augment performance. Ongoing monitoring of targeted key organisms by quantitative polymerase chain reaction (qPCR) and the overall microbial community diversity by next generation sequencing (NGS) can measure the response of a site’s microbial community to remedial activities (ITRC 2011b) and (Shook 2004). These measurements can indicate whether the microbial community is sufficient to support ongoing biodegradation of the contaminant(s) or whether bioaugmentation or other amendments may be necessary. After enhanced bioremediation, and particularly after bioaugmentation, testing to confirm introduction, increase in abundance, and spread of key biodegradative organisms helps gauge the success of the remedy.

Microorganisms (bacteria) break down contaminants. Molecular tools including qPCR tests or NGS can be used to measure the presence and quantity of specific microorganisms that are capable of biodegradation of targeted contaminants. The use of molecular tools can address these questions:

  • Are microorganisms present that are capable of degrading the contaminant(s)? If so, how many and where?
  • Is MNA feasible?
  • Are amendments required? If so, which nutrients and how much?
  • Is bioaugmentation necessary?

Detection of specific microbial groups known to be capable of degrading a contaminant provides one line of evidence that bioremediation may be possible (ITRC 2011b, 2013a).

4.4.4.2 Shifts in Isotopic Signature

▼Read more

For the most technically challenging projects, additional tools can be used to monitor and evaluate performance. In the course of many biochemical and abiotic reactions, molecules containing lighter isotopes (for example 12C) tend to react more rapidly than molecules containing heavier isotopes (for example 13C). As the reaction proceeds, the ratio of stable isotopes in the material that remains behind becomes isotopically heavier or enriched. This shift in the ratio of 12C to 13C can be measured by CSIA and can provide unequivocal evidence of degradation. It can also provide information for a direct calculation of degradation rates, thus providing data in support of two lines of evidence of contaminant degradation. For more information see ITRC’s “Environmental Molecular Diagnostics” technical and regulatory guidance document, chapter 3 (ITRC 2013a).

Each injection campaign is followed by a series of stages during which different processes dominate. Knowing what occurs in those stages is fundamental to knowing if an injection event was successful and if further injections are warranted. For example, following ISCO, the first stage is destruction of the contaminant in the dissolved phase. This is marked by the CSIA values getting much heavier for the dissolved contaminants. The second stage is dissolution of undegraded contaminant from the solid phase. This second stage can result in rebound and the CSIA values getting lighter and looking more reflective of undegraded contaminant. The third stage is the slow destruction of that desorbed contaminant. Here we see the CSIA values again getting heavier. If the injection is monitored only once, at a time well into the third stage, the effectiveness of the injection will be underestimated, as will the role of the contaminant mass on the solid phase. The first leads to the mistaken impression that the injection was minimally effective, and the second leads to an underestimate of just how much mass is stored in the solid phase. That underestimation could cause future remediation efforts to be undersized and far less than optimal. Injections of bioaugmentation/biostimulation amendments have an effective stage in which the CSIA values get heavier and an exhausted stage in which the CSIA values are constant. In simple systems contaminant concentrations generally decrease and CSIA values get heavier. However, varying flow conditions or the presence of NAPL may make concentration monitoring an ineffective tool for monitoring the onset of the exhausted stage. For optimal performance, semiannual monitoring is recommended to see if the amendment is exhausted. Less frequent monitoring can lead to longer periods between injections and longer cleanup times.

Because isotopic ratios can yield information about the presence of NAPL, it is possible to distinguish dilution from degradation. Isotopic ratios can provide information about the mechanism of that degradation. Optimization may include a stable isotope survey to test and/or refine the CSM. The specific design of the survey depends on the current CSM; however, to characterize the smallest sites, one sample for CSIA may be taken in each critical area of the site with a minimum sample size from four monitoring wells. The samples can be collected during a routine sampling event. This data set could then be used to determine if optimization decisions require more detailed stable isotope information in key areas of the site. For example, to better understand the nuances of which degradation mechanisms are active in each area of the plume or to see where undegraded contaminant mass is entering the dissolved phase, a comprehensive survey of CSIA across the entire plume is recommended (typically requiring 12–20 wells, depending upon the size and complexity of the site). CSIA surveys would be performed upgradient, in the source zone, along the center flow line and throughout the plume area, and include a vertical dimension (USEPA 2008). Both spatial and temporal sampling designs may be developed for CSIA surveys. This survey would inform optimization strategies and establish a baseline against which future monitoring results can be compared to assess progress.

4.4.5 Monitoring Data Assessment

Data evaluation and interpretation are key components to assess whether remedial objectives are being achieved and at a sufficient rate (i.e. is performance of a remedial approach indicative of a successful outcome?). A variety of tools and methods can effectively evaluate data to establish whether progress toward objectives is being made, generally including updating the CSM, statistical analysis, and modeling, which can include predictive and validation modeling.

In reviewing or evaluating the adequacy of the performance monitoring data, the following questions should be asked:

  • Are the correct media and zone of contamination being monitored?
  • Are the monitoring locations in sufficient quantity and located at distances to allow reliable data to be collected regarding injection distribution and concentration reduction?
  • Is the correct delivery mechanism being used to implement the technology?
  • Are the COCs and all potential byproducts being monitored?
  • What other parameters represent lines of evidence to support the remedial goals for the site in question?
  • Is the current level of data collection sufficient to enable the performance metrics to be analyzed?

Performance parameter selection depends on the type of in situ technologies applied (for example, ISCO, bioremediation, etc.). The parameters to be monitored should coincide with the baseline sampling and with evaluating the end points. Performance data may include geochemical, hydrogeologic, and microbial data along with the evaluation of chemical, physical, or biological processes in the subsurface.

Tracking changes in geochemistry is also useful in evaluating the long-term effectiveness of a prescribed injection system. It is common to simultaneously evaluate geochemical parameters while performing groundwater monitoring events. However, geochemical parameters may be evaluated on a different frequency. Evaluating geochemical changes versus time can aid in evaluating the subsurface activity and distribution of the injected material. For example, a significant increase in methane concentration within the hot spot of a petroleum plume or after an anaerobic substrate injection would indicate an increase in microbiological activity in the affected area. Additionally, geochemical isopleths aid in visualizing the extent of an injection’s dispersion. Conversely, no change in geochemistry may indicate the injected material has not reached or sufficiently affected its intended target area. Other factors could contribute to system performance that does not meet design expectations. Please refer to Section 1.3 to identify a path forward once performance is deemed inadequate.

Performance monitoring is an iterative process and will need to be completed throughout treatment to provide information for optimization. These questions will provide a basis for this monitoring, and if inadequate performance is identified, the information in Section 2 can be used to evaluate next steps.

To assess overarching functional objectives such as exposure, extent, fate, and transport of COCs in a source zone or plume, as well as progress on remedial actions, SMART attributes (specific, measurable, attainable, relevant, and time bound see ITRC 2011c for a description of SMART objectives and the assignment of attributes) need to be assigned to the remedial objectives. This process will define a specific measurable quantity or metric for each medium to be monitored. When setting SMART attributes for the remedial action, each attribute should be considered and modified to be site-specific. The following provides an overview of key performance metrics to consider in setting up the monitoring program.

4.4.5.1 Concentration

▼Read more

Contaminant concentrations in soil, groundwater, and soil vapor are used to assess the site’s remedial progress and compliance. Screening values and numeric, chemical-specific remedial goals are typically concentration-based metrics used to evaluate compliance. An analytical value represents an average concentration in the media collected at the location and depth interval of the sampling device during the time of the sample collection. This is an important consideration given the role concentration data play in the decision-making process. A rigorous assessment of sampling methodologies, their influence on the sample results, and their relationship to the performance metric or remedial goal should be carefully considered in the monitoring approach. Bias in sampling methods (e.g. the effect of pumping rate on the groundwater sample, seasonal influence, etc.) should be recognized and mitigated or eliminated if possible.

Compliance monitoring data should be evaluated to assess trends associated with the remedial action. Isoconcentration plots are a common way to evaluate the data. Linear regression trends such as concentration vs. time and distance plots are also common means of evaluating data. However, statistical analysis such as Mann-Kendall should be performed periodically to determine if the trends are statistically significant, stable, or nonexistent.

In addition to the targeted COC, byproducts of the treatment should be monitored and evaluated during the postinjection sampling events. These byproducts or daughter products, depending on the remedial technologies used, should be evaluated to optimize treatment.

4.4.5.2 Mass

▼Read more

Estimating the mass of a contaminant removed, reduced, destroyed, or remaining from a COC plume (source zone or downgradient plume) can be an effective way to evaluate system performance and assess potential exposure. An estimate of mass destroyed can be derived by calculating the total mass balance, including the degradation products, or measuring the difference between the initial and final aqueous mass. (ITRC 2010) pointed out:

“Many regulatory discussions about sites with groundwater contamination are driven by point-in-time measurements of contaminant concentrations snapshots of contaminant concentrations that may appear to be relatively stable or to show notable changes over time. However, concentration data alone cannot answer all questions critical to contaminant plume assessment or management.”

Like concentration data, sufficient data should be available to estimate the mass of the contaminant. This estimate should encompass the area where the injection is expected to occur. These data will then be used to assess mass reduction after the injection delivery. Note that it may be very difficult to estimate the mass due to uncertainties in the contaminant distributions and the potential presence of NAPL; mass data should be carefully assessed to account for this uncertainty.

Using the performance monitoring data, the estimates of mass reduction can be made throughout the remedy implementation to assist in evaluating system performance and optimization.

4.4.5.3 Mass Flux/Discharge

▼Read more

Contaminant mass flux and mass discharge, in conjunction with contaminant concentrations, are used to better understand contaminant behavior and encourage more precise decisions on remedial activities (ITRC 2010; ESTCP 2010b).

These estimates have limitations and inherent uncertainty. In fact, the uncertainty can be significant and should be quantified and considered relative to the typically more certain “concentration only” approaches. The degree of accuracy required for mass flux or discharge estimates should be selected based on remedial objectives (ITRC 2011c). Even with the uncertainty found in these measurements, mass flux and mass discharge data can help with the following:

  • combine contaminant concentration and groundwater movement data
  • quantify changes in contaminant mobility and movement over time
  • enhance evaluation and optimization of remedial technology and system operation

In some cases, an initial rough approximation may be sufficient, while more accurate measurements are necessary to understand the value of continued remediation on mass transport.

Using the performance monitoring data, the reduction of mass flux/discharge from the treatment area can be made throughout the remedy implementation to assist in evaluating system performance and in optimization.

4.5 Implementation Optimization

Optimization improves the protectiveness and cost-effectiveness of remedial actions. This is consistent with the general definition given in the ITRC Remediation Process Optimization guidance document (ITRC 2004), which emphasized efforts to maximize protectiveness and minimize cost. As used in this document, optimization is defined in a more rigorous way, emphasizing the process to make remedial efforts “…as fully perfect, functional or effective as possible” (Section 4.4.2.1). Optimization can be quantitative (formal) or qualitative.

Agencies at the local, state, and federal levels and private sector have worked over the years to use optimization practices and come to a consensus on optimization lessons learned and optimization reviews and how they apply to ongoing environmental projects throughout the regulatory process for the benefit of all. Where applicable, optimization stakeholder meetings and other aspects of optimization activities may be considered (USEPA 2013).

4.5.1 Formal Optimization Techniques

▼Read more

Employing formal optimization techniques can help to find the optimal conditions or actions that minimize time or cost for remediation subject to project constraints (for example, budget, plume extent, physical limitations). These techniques are usually coupled with some type of simulation software that predicts the future state of the system given various chemical, hydraulic, and physical input parameters. The formal optimization techniques explore potential actions that result in cost reduction or time reduction to attainment of a remediation goal (for example, concentration or mass discharge).

For in situ remediation technologies, the optimization tools simulate the impact of change on the remediation. The optimization tools would allow a determination of the optimal spacing, timing, and quantities of amendment, as well as the optimal transition points in a treatment train approach, or transition to MNA, to minimize cost or time for remediation. These methods can also determine a trade-off curve to find a most favorable combination of effort, cost, and time.

Work on the application of these techniques specific to in situ remediation, including the use of amendment injection, has been sponsored by the Department of Defense Strategic Environmental Research and Development program (SERDP) and conducted by Dr. J. Parker and colleagues (Parker 2011). The demonstration sites used in the SERDP projects have included injection technologies and considered the optimal injection programs, as well as the transition in time and space from one technology to another. The work also evaluates the uncertainty in the optimal approach.

ESTCP project ER-200318 (ESTCP 2011b) Final Report-Fort Lewis Diagnostic Tools for Performance Evaluation of Innovative In situ Remediation Technologies at Chlorinated Solvent-Contaminated Sites. The report includes performance criteria and recommended use along with technology costs for 3-D sampling of multiple level wells, CSIA, molecular diagnostic tools, and mass flux analysis. The report explains how molecular tools such as qPCR may be recommended for DHC and function genes, but not recommended for methanogens at most sites, while other specific molecular tools were not applicable

Another related effort funded in part under the Department of Defense Environmental Security Technology Demonstration Certification Program (ESTCP) was the development of the PREMCHLOR tool that allows a probabilistic evaluation of the effect of uncertainty in the site and design parameters for source and dissolved plume remediation (ESTCP 2011a). The report is freely available, as is the code.

These tools may be particularly useful for large and expensive in situ remediation projects, but can be applied to sites of any size. The data needed to support these analyses may include the approximate unit costs for different actions or injection amendments, monitoring costs, and uncertainty estimates for contaminant extent or mass, effectiveness of delivery, etc. Observations from pilot testing may allow estimation of some of these parameters.

4.5.2 Optimization and Verification of Treatment Effectiveness

▼Read more

The monitoring recommended for evaluating performance of the injection program should be used to assess the appropriate changes for additional injection events (ITRC 2011c; USEPA 2011b, 2018b). Although design, based on careful site characterization, would provide a starting point for the injection project, the observations of contaminant and amendment concentrations, groundwater geochemistry, hydraulic responses, and high-resolution profiling, etc., following initiation of the project allow an observational approach for optimization of the remaining project. In many respects, the initial injection event is an effort to validate the RDC and provide clues for optimization. Rarely are in situ treatment objectives met after one injection due to matrix back-diffusion, site heterogeneity, and delivery challenges. In fact, the first injection often leads to upsets and redistribution of contaminants. The areas and depths of the TTZ that do not respond to injection as anticipated are identified and addressed through a multistep process to optimize subsequent injection(s). In situ remediation commonly fails when the initial injection scheme is repeated, often to recoup the investment in permanent injection wells, rather than reacting methodically to what the performance monitoring data are telling us. The data following the initial injection event should be critically reviewed as if evaluating a pilot study.

Optimization follows a systematic process. First, the volumes that are inadequately treated, or that are unlikely to reach treatment goals within the targeted treatment times, are identified through the evaluation of the monitoring data, consideration of subsurface transport, and injection program performance (for example, volumes injected, refusal for direct push points, pressures used). The amendment concentration may need to be sustained, particularly with biological processes, for a long period of time to establish optimal conditions for remedial process (see Section 3.5). With ISCO applications the reaction may be occurring too quickly, which leads to costly waste of amendments. With other amendments, if the reaction occurs too slowly, amendments may be washed out of the treatment area by groundwater movement before an effect is observed. The three-dimensional extent of those problematic areas needs to be identified. Flow and transport modeling may be useful to assess areas that may not be adequately treated over time (see Section 3.5).

Second, the cause for the poor performance is identified. Hydrogeologic data, site history, geochemical conditions, and soil/rock physical properties should be evaluated and the CSM updated (see Section 4.4.2.1). Examples of the modifications to the conceptual model could include the addition of a new preferential pathway for amendments, lower permeability of target materials than expected, excessively high pressures used during injection, additional existing chemical/amendment demand, or inadequate microbiology. The analysis of the cause(s) of poor performance is best done by practitioners, in multiple technical disciplines, to ensure that all aspects contributing to the poor performance are identified.

Finally, optimization revisions are proposed for subsequent injections. Modeling may again be useful to support recommendations. The recommended optimization actions could address:

  • changes in injection spacing, location, and depth/vertical interval
  • changes in delivery method, including injection methods, pressures, rates of delivery, or use of permeability enhancement
  • changes in amendment concentration, type, or mix (for example, activators, biological cultures)

The optimization recommendations are implemented and performance monitoring continued. The performance monitoring program itself may also be optimized based on the observed responses. Additional monitoring points or parameters may be added and the frequency of the monitoring itself may be modified—either increased or decreased. Monitoring locations may also be removed if in areas that have attained goals, or that are not functioning.

The optimization process may be repeated multiple times during the project duration. These modifications, if based on solid analyses, will reduce project costs and duration. A checklist for optimization of injection programs is provided as Appendix F to this document.

4.5.3 Changing Conditions

▼Read more

More complex circumstances are those that are not expected; however, based on the experience of professionals working on similar projects, these circumstances should be considered in advance in the event a contingency plan is necessary to address these conditions. These situations should be evaluated as part of the remediation risk analysis and documented in the risk register or change management system. The mitigation measures for significant risks should also be documented. Note that some of the risks can and should be addressed with some preinjection testing or characterization. Below are some of the circumstances to consider and for which to prepare contingencies.

  • The specified injection volumes take longer than expected, lower injection rates are required, or the injection plan cannot be completed at design pressures, resulting in lower injection rates.
  • Daylighting of amendment occurs (for some applications, this has a high probability of occurring).
  • Amendment does not propagate the expected distance or at the expected volume to achieve ROI.
  • Oxidant demand is greater than anticipated despite bench testing on representative soils.
  • pH drops substantially.
  • Injection wells become clogged or the formation will not readily accept amendment.
  • Amendment is diverted outside the TTZ (for example, vadose zone when the saturated zone was the target).
  • Direct push technologies are not able to reach the design depths in portions of the site.
  • Injection displaces the plume into previously unaffected areas.
  • Mixing equipment malfunctions.
  • Direct push equipment breaks down.
  • Mechanical equipment and system infrastructure fail.

The mitigation measures or contingencies to be considered may include:

  • increasing or decreasing injection pressures
  • use of hydraulic or pneumatic fracturing emplacement
  • routine rehabilitation program for injection wells
  • availability (on site and contractually) of additional amendments and increases or decreases in volumes or concentrations
  • adding injection points in between existing transects or wells
  • assessment of alternative drilling methods and knowing the contractor can have the equipment with minimal delay
  • enhancing transport through groundwater extraction and recirculation or operating in conjunction with phytoremediation for hydraulic control
  • spare parts inventory available on-site during the injection process.

Other risks and contingencies would be site-specific, and the risk assessment method will help address these.

Based on results of the performance monitoring data, a remediation project may be able to transition to closure, MNA, or in some cases, an alternate remedy (Appendix E.7, Terra Vac under USEPA’s Demonstration Program Conducted Soil Vapor Extraction (SVE) in the Source Area). In this subsection, both intentional and unplanned transitions are discussed. Keep in mind that for very large plumes, where in situ injections are performed as an interim measure as a part of mass reduction and overall plume management, this logic may not apply.

4.5.4 Subsequent Amendment Applications

▼Read more

Planning for injection events subsequent to the initial event is typical for most in situ remedial technologies considering site heterogeneity and matrix back-diffusion and should be included in the implementation plan along with triggers for reapplication described in the monitoring plan. In most cases the additional injection events are expected and meant to address areas not fully dosed due to substantial demand for the amendment or incomplete contact with the contaminant due to site heterogeneity or dissipation of the amendment before the remedial objectives were achieved. In other cases, repeated injections are required to treat continuing contaminant mass flux as part of a barrier configuration or for treatment of mass discharge from an inaccessible source area (Appendix E.14, Naval Submarine Base, Kings Bay, Site 11).

In these situations, the locations and dosage of additional injection events are tailored based on monitoring results indicative of contaminant rebound or diminished amendment concentrations. Other modifications could include tailoring the mix of amendments to adjust to other observations, including microbial populations, pH, DO, and ORP. Both schedule and budget for the project should be developed accounting for these potential needs. For instance, as a cost-saving measure, analysis of microbial populations at a bioremediation site is not conducted until the data indicate that reactions are not going to completion despite the presence of adequate electron donor and ideal geochemistry, as demonstrated by lower cost analytical parameters. At this time, it is beneficial to invest in microbial analyses to evaluate optimization of the remedy through bioaugmentation.

In most in situ injection applications, it is not uncommon to see more than one application of amendments for the successful treatment of subsurface contamination. Amendment applications are often designed to be multi-injection events and are planned and funded accordingly. Sometimes subsequent injections are necessary based on the conditions observed in the site as a result of initial injections. Insufficient understanding of the site-specific conditions may result in improper and ineffective amendment applications, which will result in not meeting the intended goals, exceeding time to completion and cost to completion estimated in the planning stage.

Subsequent amendment applications can be planned and performed in many ways. Some of the approaches for these applications include:

  • division of the plume into areas of priority to implement injections in a systematic manner (for example, cut-off zones)
  • targeting areas where baseline concentrations were higher or the ROI was limited versus a shotgun approach where more amendment is needed in treating the entire area
  • changes to the amendment formula to include nutrients, microbes, pH adjustment, or activators
  • application of different amendments to address daughter products (for example, emerging contaminants) or byproducts that may require different processes to successfully meet the goals for all constituents
  • vertical and horizontal isolation of target areas for maximum effectiveness
  • limits on the maximum dosing of amendments or total volumes that can be injected during a single event

In many cases, subsequent applications are necessary as a consequence of changing site conditions, which were not originally anticipated.

4.6 Transition and Contingency Planning

Two types of conditions have been identified to require transition and contingency planning: anticipated subsequent application events that are commonly included with in situ injection programs (for example, ISCO), and unexpected conditions that may occur related to injection events. Both conditions are addressed with the suggested contingencies. The practitioner must consider the risk of these conditions for the site during the planning stage of the project and develop contingencies for those risks so a contingency plan can be implemented quickly.

When the risk justifies it, a mitigation or contingency strategy is developed. This risk management approach is outlined in Project Risk Management for Site Remediation (ITRC 2011d). The approach involves the preparation of a risk register that summarizes the various risks and their likelihood and impact. If the risk is small (highly unlikely or very minor impact), the risk can just be accepted. If the risk is substantial (likely occurrence and significant impact on cost and schedule), then there should be a plan to address this if the condition occurs.

4.6.1 Intentional Transition Planning

▼Read more

Naval Submarine Base Kings Bay Site 11 has used pump and treat—in situ chemical oxidation—biostimulation—monitored natural attenuation (NAVFAC 2013a) Since 1999, two long-term monitoring programs have been conducted at Site 11, including monitoring as required by the RCRA permit, and performed in accordance with the associated groundwater monitoring plan (GWMP) (Bechtel 1999), and monitoring conducted by the U.S. Geological Survey (USGS) in coordination with the Navy to evaluate the effectiveness of natural attenuation processes in reducing contaminant concentrations (USGS 2009). The RCRA permit required that monitoring begin in 1999, and the monitoring program was adjusted several times based on the exit strategy provided in the GWMP and other recommendations from the Georgia Environmental Protection Division. The USGS monitoring was conducted from 1999 to 2009 at a number of designated wells. The study confirmed the effectiveness of natural attenuation processes at Site 11 (USGS 2009). After the completion of the USGS study, these USGS monitoring wells were not sampled in 2010. Groundwater was sampled in 2011 and a new sentinel well was installed in 2012. Optimization reports have been performed and the site is currently under a monitored natural attenuation phase.

Closure is perhaps the easiest transition to make because it assumes all monitoring wells or sitewide average concentrations meet the remedial action goals set by the lead regulatory agency and maintained those water quality goals for a specified duration. Once these criteria are met, the regulatory agency can grant closure. As a precaution, it is recommended that the CSM be thoroughly reviewed to verify that the monitoring well network adequately evaluates the vertical and lateral extent of previously affected areas. Once all regulatory requirements have been met and closure is granted by all regulatory agencies, be sure to properly abandon all remediation infrastructure and monitoring wells.

Many sites where in situ injections are performed will transition to MNA (see Section 3.2.3). Before ceasing active remediation and transitioning to MNA, develop an accurate estimate of how many years the project will be monitored and prepare a cost-benefit analysis of MNA compared to additional active remediation, recognizing the potential limitations for active treatment of residual mass. While logical and enticing to terminate active remediation, MNA guidance is prescriptive and can be expensive to follow. In many cases the life cycle cost of a remediation project can be reduced with additional targeted active remediation. In other cases, the technology has accomplished significant reduction in contaminant concentration and the residual impacts will naturally attenuate at approximately the same rate as would continuing active remediation. Review figure 2-1, expanded MNA/EA decision flowchart, (ITRC 2008a), for the use of monitored natural attenuation and enhanced attenuation at sites with chlorinated organic plumes in Performance Assessment for Pump and Treat Closure or Transition (PNNL 2015), and other guidance appropriate for other site-specific constituents of concern and individual state guidance to verify that the site is a candidate for MNA. Furthermore, review the CSM to verify that the monitoring network adequately evaluates the vertical and lateral extent of the residual impacts. Abandon wells that are no longer necessary and replace wells that have been damaged or need to be relocated to allow for development of the site.

For a statistical approach, refer to “An Approach for Evaluating the Progress of Natural Attenuation in Groundwater (USEPA 2011a). (ITRC 2016, 2013b) use a regression analysis or nonparametric analysis such as Mann-Kendall (for example, MAROS or ProUCL). Numerical reactive transport modeling such as RT3D (Microsoft Excel-based platform) provides a tool with which to quantify the relative stability of a contaminant plume, particularly in cases where simpler evaluations are not suitable because of complex hydrology, past activity at the site, multiple contaminant sources, and/or complex reaction of multiple species (Johnson 2006). Selection of an appropriate model configuration to represent spatial and temporal variations in site-specific attenuation processes can facilitate assessment of the contaminant loading and attenuation capacity (that is, mass balance) at the site.

In some cases, the remedial action plan includes a treatment train. A treatment train may be necessary for large plumes or those with extremely high concentrations in the source area, whereby a more cost-effective remedy can be implemented once an interim remedial goal is reached. In other cases, the daughter products or residual constituents are more effectively treated using a different technology. For example, in situ thermal remediation may be used to reduce NAPL or high concentrations in the source area quickly. However, due to high operating costs and the lateral extent of the plume, it is more cost-effective to treat the downgradient portions of the plume with EISB or heat-activated persulfate. Many potential combinations of remedial technologies are effectively used in tandem (see table 4-1 in (ITRC 2011c)). The metrics and decision points for the transition should be clearly identified. The metrics may be concentrations, concentration trends, or mass flux/discharge. Be mindful that not all technologies are compatible. For instance, if a source area is treated using ISCO, the area may be too oxidized to effectively and efficiently follow with an anaerobic EISB to achieve cleanup criteria unless large doses of substrate, pH adjustment agents, and bioaugmentation culture are injected. As a result, it would likely be effective to implement an anaerobic EISB to remediate groundwater impacts downgradient of a source area that was treated with ISCO. For more discussion on treatment trains and technology compatibility, review chapter 4 of (ITRC 2011c).

4.6.2 Contingent Remedy Transition Planning

▼Read more

In cases where the initial remedial technology fails to achieve the desired goal, an alternate remedy must be implemented. Many Comprehensive Environmental Response, Compensation, and Liability Act (CERCLA/Superfund) sites include an alternate remedy in the record of decision (ROD). However, as technology advances, the approved remedy and the alternate remedy may no longer be the best technology for a particular site and reopening the ROD may be the most cost-effective and appropriate outcome for a site (Appendix E.11, Eastern Surplus Company Superfund Site). Depending on the factors that limited the effectiveness of the selected remedy, an alternate in situ remedy may not be appropriate. For more discussion on remedy evaluation, review chapter 6 of (ITRC 2011c).

The criteria for transitioning to the alternate remedy is often poorly defined. Statistical evaluation of performance monitoring data using a regression analysis or nonparametric analysis such as Mann-Kendall (MAROS or ProUCL) is commonly used to determine if the remedy is performing (see Section 4.6.1 for more examples and references). If there is a trend in performance monitoring data immediately downgradient of the treatment zone, but no significant trend observed farther downgradient within the modeled time frame, several things could be happening.

  • The remedy may need more time to respond because the retardation of amendments in the aquifer matrix was not fully understood.
  • The advective transport velocities may have been overestimated.
  • There may be additional source materials that were not addressed by the prior treatment.
  • Back-diffusion may provide a persistent source of COCs from less mobile portions of the aquifer or partitioned mass may require significant time to become available for treatment through diffusion.
  • If ISCO was used, it could be that the native organics were oxidized before the anthropogenic organics, and there is not enough oxidant to effectively treat the COCs.
  • There could be a preferential pathway through which the amendments traveled, and distribution of amendments throughout the area of concern could not be achieved.

See 4.4.1.3 for a list of common issues encountered during implementation and postimplementation monitoring of in situ treatment technologies. This table provides links to additional information within this document or external citations or web links for guidance on a wide variety of in situ technologies, amendments, emplacement technologies, and monitoring protocols. Revisit the CSM for the site and update it to include all new information learned during implementation of the initial in situ remediation technique.

image_pdfPrint this page/section
Click here to download the entire document.

glossary

OIS-ISRP

Download Complete Document
glossaryOIS-ISRP-1
Glossary
referencesOIS-ISRP-1
References
acronymsOIS-ISRP-1
Acronyms

ITRC
Contact Us
About ITRC
Visit ITRC
social media iconsClick here to visit ITRC on FacebookClick here to visit ITRC on TwitterClick here to visit ITRC on LinkedInITRC on Social Media
Permission is granted to refer to or quote from this publication with the customary acknowledgment of the source (see suggested citation and disclaimer). This web site is owned by ITRC • 1250 H Street, NW • Suite 850 • Washington, DC 20005 • (202) 266-4933 • Email: [email protected] • Terms of Service, Privacy Policy, and Usage Policy ITRC is sponsored by the Environmental Council of the States.