• Skip to main content
itrc_logo

Optimizing Injection Strategies and In situ Remediation Performance

Home
About ITRC
Navigating this Website
1 Introduction
1 Introduction Overview
1.1 The Problem and the Need for Optimization
1.2 Intended Audience
1.3 Approaches to Optimizing an In Situ Remedy
1.4 Document Organization
2 Remedial Design Characterization
2 Remedial Design Characterization Overview
2.1 Cost Benefits of RDC
2.2 Characterization Parameters for Refining the CSM
2.3 RDC Considerations
3 Amendment, Dose, and Delivery Design
3 Amendment, Dose, and Delivery Design Overview
3.1 The Design Wheel and Optimization Process
3.2 Design Considerations
3.3 Design Support Elements
3.4 Amendment Selection Considerations
3.5 Amendment Dose Requirements
3.6 Amendment Delivery Optimization
3.7 Delivery Layout Design and Volume per Location
3.8 Delivery Strategies
4 Implementation and Feedback (Monitoring) Optimization
4 Implementation and Feedback (Monitoring) Optimization Overview
4.1 Pre-implementation Considerations
4.2 Adaptive Implementation and Feedback Optimization
4.3 Implementation and Optimization Staircase
4.4 Monitoring
4.5 Implementation Optimization
4.6 Transition and Contingency Planning
5 Regulatory Perspectives
5 Regulatory Perspectives Overview
5.1 Statutory Challenges
5.2 Traditional CERCLA Site Cleanup Process
6 Community and Tribal Stakeholder Considerations
6 Community and Tribal Stakeholder Considerations Overview
6.1 Background
6.2 Identifying Stakeholders
6.3 Stakeholder Concerns
6.4 Approach to Stakeholder Engagement
6.5 Communications
Additional Information
Appendix A. Amendments and Other Additives
Appendix A. Amendments and Other Additives Overview
A1 Common Biotic Amendments
A2 Abiotic Amendments
A3 Other additives
Appendix B. Commonly Encountered Issues with In situ Remediation
Appendix C. Characterization Parameters for In situ Treatment Remedies–Definitions and Descriptors for Table 2-2
Appendix C. Characterization Parameters for In situ Treatment Remedies–Definitions and Descriptors for Table 2-2 Overview
Physical Properties
Transport Properties
Aqueous Geochemistry
Degradation Potential
Appendix D. Injection Fact Sheets
Appendix D. Injection Fact Sheets Overview
D1 Direct Push Delivery Methods
D2 Injection Through Wells & Boreholes
D3 Electrokinetics Delivery Methods
D4 Solid Injection Principles
D5 Hydraulic Fracturing–Based Delivery Methods
D6 Pneumatic Fracturing–Based Delivery Methods
D7 Permeable Reactive Barrier Construction
Appendix E. Case Studies
Appendix E. Case Studies Overview
E-1. In Situ Biological and Chemical Reduction of Hexavalent Chromium and Perchlorate
E-2. Strontium-90 Apatite Permeable Reactive Barrier
E-3. Rapid Site Closure of a Large Gas Plant Using In Situ Bioremediation Technology in Low Permeability Soil and Fractured Rock
E-4. Performance of Injected Powdered and Liquid Activated Carbon at a Petroleum Hydrocarbon Site
E-5. Lawrence Livermore National Laboratory—Annual Groundwater Report
E-6. Oxidant Surface Eruption During Direct Push Injection
E-7. TerraVac Under EPA’s Demonstration Program Conducted SVE in the Source Area
E-8. Unusual Dichloroethylene Isomerizations and External Nitrate Input to Help Decipher in Situ Pilot Test Outcomes
E-9. In Situ Bioremediation and Soil Vapor Extraction at the Former Beaches Laundry & Cleaners
E-10. LNAPL Remediation Combining Mobile Dual Phase Extraction with Concurrent Injection of a Carbon-Based Amendment: Little Mountain Test Facility
E-11. Eastern Surplus Company Superfund Site, Southern Plume: Meddybemps
E-12. Hollingsworth Solderless
E-13. Former Industrial Site Characterization and Remediation in Fractured Rock
E-14. Naval Submarine Base Kings Bay, Site 11
Appendix F. Performance Evaluation & Optimization of In situ Remediation using Amendment Delivery
Appendix G. Optimizing Injection Strategies and In situ Remediation Performance
Glossary
References
Acknowledgments
Team Contacts
Document Feedback


Optimizing Injection Strategies and In situ Remediation Performance
HOME

Appendix G. Optimizing Injection Strategies and In situ Remediation Performance

Click here to view the entire Appendix G in Adobe PDF format.

The links below will open individual survey questions.

Q1
Identify your affiliation
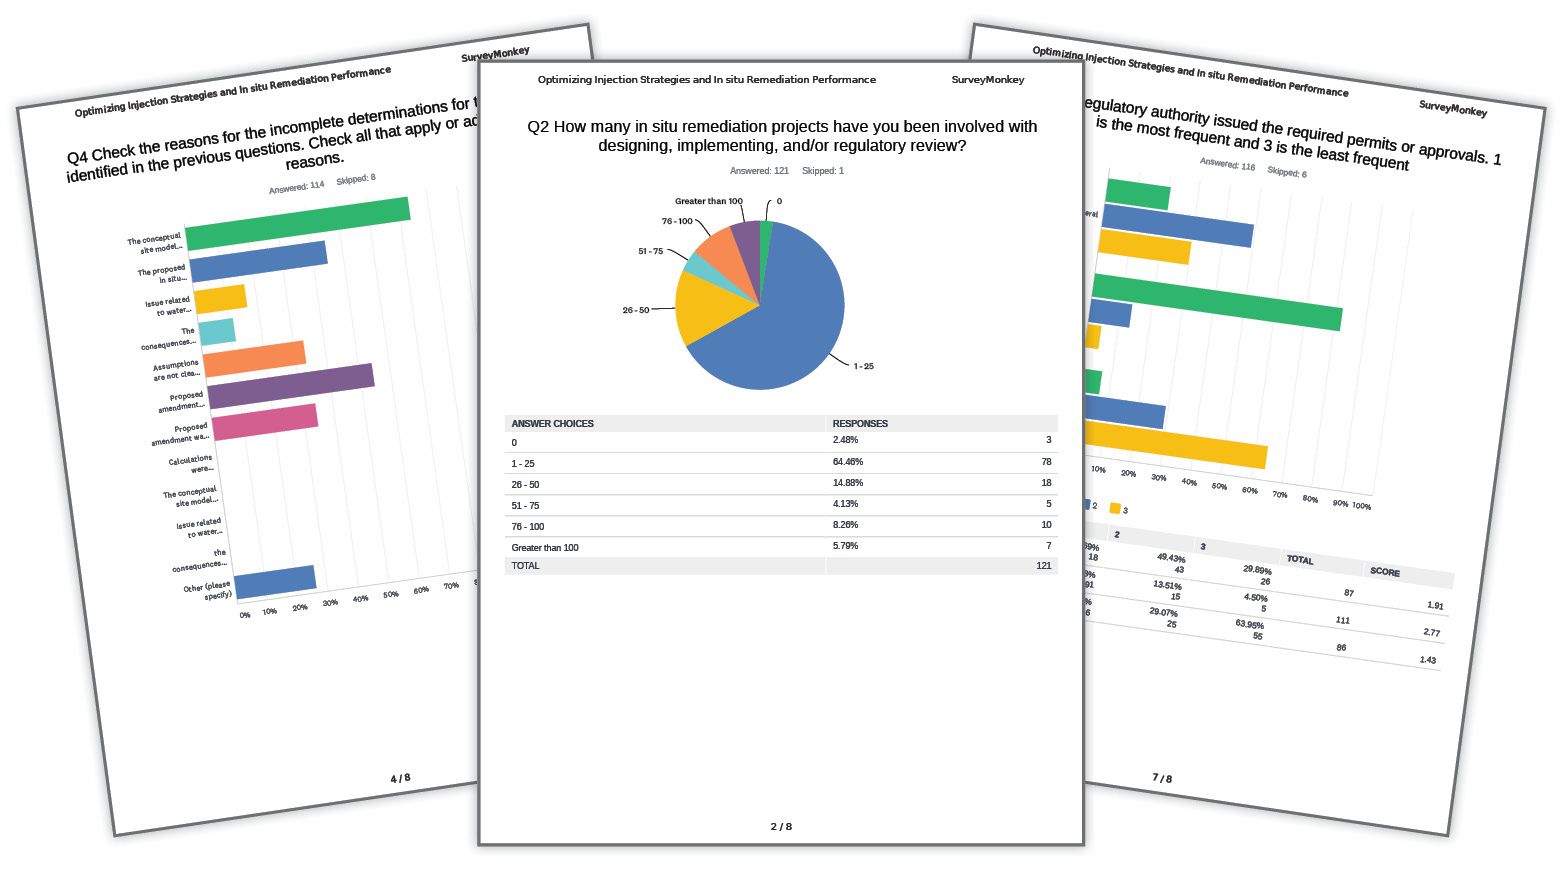
Q2
How many in situ remediation projects have you been involved with designing, implementing, and/or regulatory review?

Q3
From the number of projects identified in the previous question; what percentage of projects did not provide adequate information in the first submittal to demonstrate the selected remedy would be successful?

Q4
Check the reasons for the incomplete determinations for the projects identified in the previous questions. Check all that apply or add additional reasons.

Q5
What was the root cause(s) for the inadequate information provided in those projects that did not support the selected remedy?

Q6
Which regulatory authority issued the required permits or approvals. 1 is the most frequent and 3 is the least frequent

Q7
Please include your contact information in case clarification is required

image_pdfPrint this page/section
Click here to download the entire document.

glossary

OIS-ISRP

Download Complete Document
glossaryOIS-ISRP-1
Glossary
referencesOIS-ISRP-1
References
acronymsOIS-ISRP-1
Acronyms

ITRC
Contact Us
About ITRC
Visit ITRC
social media iconsClick here to visit ITRC on FacebookClick here to visit ITRC on TwitterClick here to visit ITRC on LinkedInITRC on Social Media
Permission is granted to refer to or quote from this publication with the customary acknowledgment of the source (see suggested citation and disclaimer). This web site is owned by ITRC • 1250 H Street, NW • Suite 850 • Washington, DC 20005 • (202) 266-4933 • Email: [email protected] • Terms of Service, Privacy Policy, and Usage Policy ITRC is sponsored by the Environmental Council of the States.