• Skip to main content
itrc_logo

Optimizing Injection Strategies and In situ Remediation Performance

Home
About ITRC
Navigating this Website
1 Introduction
1 Introduction Overview
1.1 The Problem and the Need for Optimization
1.2 Intended Audience
1.3 Approaches to Optimizing an In Situ Remedy
1.4 Document Organization
2 Remedial Design Characterization
2 Remedial Design Characterization Overview
2.1 Cost Benefits of RDC
2.2 Characterization Parameters for Refining the CSM
2.3 RDC Considerations
3 Amendment, Dose, and Delivery Design
3 Amendment, Dose, and Delivery Design Overview
3.1 The Design Wheel and Optimization Process
3.2 Design Considerations
3.3 Design Support Elements
3.4 Amendment Selection Considerations
3.5 Amendment Dose Requirements
3.6 Amendment Delivery Optimization
3.7 Delivery Layout Design and Volume per Location
3.8 Delivery Strategies
4 Implementation and Feedback (Monitoring) Optimization
4 Implementation and Feedback (Monitoring) Optimization Overview
4.1 Pre-implementation Considerations
4.2 Adaptive Implementation and Feedback Optimization
4.3 Implementation and Optimization Staircase
4.4 Monitoring
4.5 Implementation Optimization
4.6 Transition and Contingency Planning
5 Regulatory Perspectives
5 Regulatory Perspectives Overview
5.1 Statutory Challenges
5.2 Traditional CERCLA Site Cleanup Process
6 Community and Tribal Stakeholder Considerations
6 Community and Tribal Stakeholder Considerations Overview
6.1 Background
6.2 Identifying Stakeholders
6.3 Stakeholder Concerns
6.4 Approach to Stakeholder Engagement
6.5 Communications
Additional Information
Appendix A. Amendments and Other Additives
Appendix A. Amendments and Other Additives Overview
A1 Common Biotic Amendments
A2 Abiotic Amendments
A3 Other additives
Appendix B. Commonly Encountered Issues with In situ Remediation
Appendix C. Characterization Parameters for In situ Treatment Remedies–Definitions and Descriptors for Table 2-2
Appendix C. Characterization Parameters for In situ Treatment Remedies–Definitions and Descriptors for Table 2-2 Overview
Physical Properties
Transport Properties
Aqueous Geochemistry
Degradation Potential
Appendix D. Injection Fact Sheets
Appendix D. Injection Fact Sheets Overview
D1 Direct Push Delivery Methods
D2 Injection Through Wells & Boreholes
D3 Electrokinetics Delivery Methods
D4 Solid Injection Principles
D5 Hydraulic Fracturing–Based Delivery Methods
D6 Pneumatic Fracturing–Based Delivery Methods
D7 Permeable Reactive Barrier Construction
Appendix E. Case Studies
Appendix E. Case Studies Overview
E-1. In Situ Biological and Chemical Reduction of Hexavalent Chromium and Perchlorate
E-2. Strontium-90 Apatite Permeable Reactive Barrier
E-3. Rapid Site Closure of a Large Gas Plant Using In Situ Bioremediation Technology in Low Permeability Soil and Fractured Rock
E-4. Performance of Injected Powdered and Liquid Activated Carbon at a Petroleum Hydrocarbon Site
E-5. Lawrence Livermore National Laboratory—Annual Groundwater Report
E-6. Oxidant Surface Eruption During Direct Push Injection
E-7. TerraVac Under EPA’s Demonstration Program Conducted SVE in the Source Area
E-8. Unusual Dichloroethylene Isomerizations and External Nitrate Input to Help Decipher in Situ Pilot Test Outcomes
E-9. In Situ Bioremediation and Soil Vapor Extraction at the Former Beaches Laundry & Cleaners
E-10. LNAPL Remediation Combining Mobile Dual Phase Extraction with Concurrent Injection of a Carbon-Based Amendment: Little Mountain Test Facility
E-11. Eastern Surplus Company Superfund Site, Southern Plume: Meddybemps
E-12. Hollingsworth Solderless
E-13. Former Industrial Site Characterization and Remediation in Fractured Rock
E-14. Naval Submarine Base Kings Bay, Site 11
Appendix F. Performance Evaluation & Optimization of In situ Remediation using Amendment Delivery
Appendix G. Optimizing Injection Strategies and In situ Remediation Performance
Glossary
References
Acknowledgments
Team Contacts
Document Feedback


Optimizing Injection Strategies and In situ Remediation Performance
HOME

3 Amendment, Dose, and Delivery Design

The remedial design process is commonly visualized as a linear sequence (see Section 5.2) that begins with the CSM; however, in practice, the overall in situ design process is iterative and cyclical with many feedback loops at any step connecting to both earlier and later steps (see Figure 3-1). Once the CSM is developed and RDC is initiated, one or more potentially viable remedial design options are identified. This remedial design consideration is a preliminary screening of potentially viable remedial alternatives considered relative to site characteristics and treatment objectives. A design is refined and further developed once the predesign investigation is complete, and the project moves to implementation. Each of these steps is an optimization step; every step in the sequence is evaluated and the results used to improve the process for the next step or used to justify returning to an earlier step in the sequence.

3.1 The Design Wheel and Optimization Process

Optimization Staircase
The cyclical nature defined in Figure 3-1 is extended into the implementation phase of testing and monitoring. Refinement of the design following selection of the amendment and the delivery strategy may involve various tests, all applying the dose, delivery, and amendment design feedback; results of each test feed refinements into a subsequent test. The same applies to the full-scale implementation phase, in which operational testing as well as performance testing could result in modifications to the dose, delivery, and even the amendment. For instance, during full-scale implementation the monitoring results may indicate that repetitive dosing or more frequent dosing may be required to achieve optimum performance.

The design wheel involves consideration of the amendment, delivery method, and dose simultaneously throughout the in situ RDC, design, implementation, and monitoring process. Any step in the sequence can be performed again as new information becomes available. For example, during the initial evaluation of remedial design options, one or more data gaps may be identified in the CSM, and the overall process returns to improve the CSM before continuing evaluation of remedial design options. Similarly, during RDC, a site characteristic may be found to be unfavorable to the remedy under consideration, which necessitates returning to the consideration of remedial design options rather than moving forward to implementation.

Each of the steps in the stages of the optimization process (Remedial Design Characterization; Amendment, Dose, and Delivery Design; and Implementation, Monitoring, and Data Analysis; Figure 3-1) must also consider the nature of the in situ remediation amendment (e.g., liquid or solid), dose of the amendment (e.g., concentration, mass, or volume), and method of amendment delivery (e.g., liquid injection or slurry/solid injection). The nature of the amendment, delivery method, and dose are all interrelated by a cyclical process (Figure 3-1). For example, a certain amendment (e.g., an organic carbon source intended to stimulate reductive dechlorination of a chlorinated solvent) may be available in solid or liquid forms, and the liquid forms may be available in a range of concentrations. The selection of solid or liquid, and liquid concentration, in turn will affect how much of the amendment is required. The amendment may also be available in a range of viscosities or densities, which (along with the nature of the amendment as a solid or liquid, and the volume of the amendment required) may affect the method of amendment delivery. Amendment delivery options may, for example, include hydraulic or pneumatic fracturing, solid, slurry, or liquid injection via direct push methods, injection via temporary or permanent wells, etc. Thus, all three factors (amendment, dose, and delivery) are simultaneously and iteratively evaluated to develop a remedial design. Design is also implicitly considered in each stage of the remedial design sequence. For example, the data needed in the predesign investigation are determined in part by the amendment, dose, and delivery method under consideration, emphasizing the cyclical and iterative nature of the overall process. The elements of the Design Wheel (amendment, dose, and delivery) are considered further in Sections 3.4, 3.5, and 3.6.

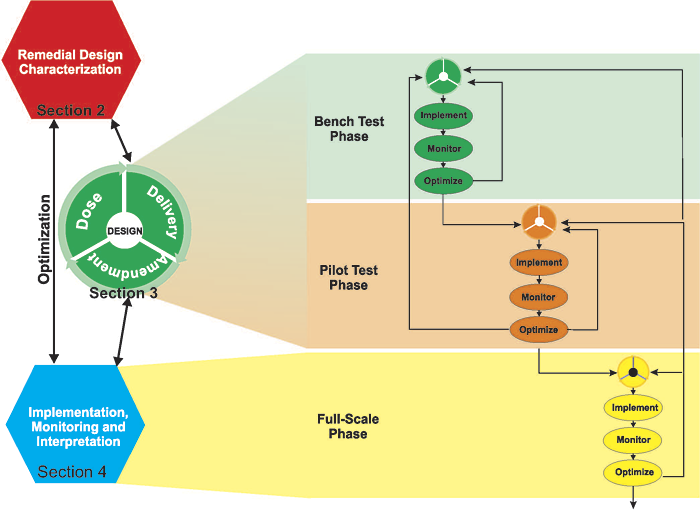
Figure 3-1. Implementation and optimization process.

3.2 Design Considerations

The following sections highlight some of the factors that need to be considered during the design process. Defining the TTZ is one of the essential first elements of remedial design. Consideration must also be given to how the selected remedy may affect subsurface conditions and the potential for secondary effects in other subsurface characteristics, in addition to the primary or desired effect. In certain situations, it may be appropriate to apply coupled in situ remediation technologies simultaneously or sequentially to effect treatment of sites (e.g., sites with contaminants in different geological units or with comingled contaminants). A final key component of the design that needs to be considered is the relationships among cost, risk, and certainty of outcome (USEPA 2016).

3.2.1 Target Treatment Zone

▼Read more

The geometry and characteristics of the TTZ, including, for example, the areal extent, depth interval, geology, hydrogeology, and geochemistry, significantly influence selection of remedial amendments, amendment requirements, delivery method, and process and performance monitoring, and nearly all other characteristics of design and implementation. Like many other aspects of remedial design, definition of the TTZ is often an iterative process that considers the collateral effects, performance, cost, and other factors of a treatment approach, and is commonly revised as subsequent aspects of a design are developed.

Key considerations for defining the TTZ include:

  • Cleanup objectives: The objective may be reduction of source area mass, protection of a particular receptor, meeting an interim remedial goal, achieving closure, or other site-specific objective. See Section 2.3.1 and (ITRC 2011c) for more details on development of cleanup objectives.
  • Spatial and temporal relationship to other remedies: If multiple remedies are planned for a site, the TTZ for each remedy must consider how the remedies may interact with each other. For example, if ISCO is selected for a DNAPL source area and ISCR is selected for a plume area, then the TTZ for each remedy should consider downgradient transport of the ISCO amendment or its byproducts to the ISCR TTZ.
  • Uncontrolled amendment discharge: The TTZ must consider the potential for unintended discharge of injected amendments. For example, if the potential exists for discharge of groundwater to surface water, then the TTZ should consider the potential for transport of remedial amendments to the discharge area.
  • Geologic, hydrogeologic, and geochemical characteristics: If, for example, the remedial design is injection of a liquid amendment, and a portion of the TTZ is characterized as very low permeability clay, then the planned design may be ineffective in the low permeability clay zone. As another example, the presence of competing electron acceptors may necessitate a modification of the TTZ for a biological approach. Methods to define the TTZ can include both empirical and modeling tools. For example, typical site characterization methods (e.g., soil borings and/or wells with associated sample analytical data, or remote direct sensing methods such as the membrane interface probe (MIP) may be used to define the volume that exceeds a cleanup standard, and therefore defines the TTZ. Sample data can be augmented with data and visualization tools to quantify TTZ volumes and geometry. Many types of amendments, such as chemical oxidants and bioremediation agents, can partially or completely dissolve in groundwater and thus undergo transport with groundwater. Fate and transport can be modeled with tools such as MODFLOW in combination with MT3DMS (Zheng 2010, 1999) to estimate the potential area of influence of the amendments, and hence the resulting TTZ (which in turn can be iteratively optimized so that the TTZ reflects the area exceeding a cleanup standard). ITRC’s Advanced Site Characterization (ITRC 2019). Guidance can help better define TTZs along with the associated hydrogeology and soil types.

Consideration needs to be given throughout the process to refine and optimize the TTZ so as to achieve the site goals in a desired time frame and reduce overall cost.

3.2.2 Secondary Effects

▼Read more

The very nature of an in situ remedy requires some type of change to geochemical, biological, hydrogeological, and/or other characteristics of the subsurface, which results in the desired remediation. Evaluation of potential secondary effects begins with an understanding of how the selected remedy may affect subsurface conditions (see Section 2.3.5.3).

Secondary effects can also occur over a wide range of time—from transient shifts lasting hours or days to long-term changes that may last for many years. Thus, all in situ remedies should consider the potential secondary effects of the remedy design, including how to evaluate (and potentially mitigate) secondary effects, beginning with bench and field pilot tests prior to implementation of full-scale remedies (Figure 3-1).

Secondary effects to be considered during remedial design include the effects of injected amendments on groundwater chemistry.

  • shifts in redox conditions and pH associated with chemical oxidants and reductants, bioremediation amendments, and other amendments, which can affect mobilization of metals, survival of microbial populations, and other characteristics
  • increased concentration of amendment components in the groundwater, which can pose residual primary and/or secondary water quality issues after the target contaminant is destroyed
  • partial transformation of target contaminants, potentially forming more mobile or more hazardous intermediate or final degradation products (such as accumulation of vinyl chloride (VC) from a perchloroethene (PCE) – or trichloroethylene (TCE) -contaminated site)
  • discharge of injected amendments to unintended locations, such as the surface, other untargeted portions of the aquifer, or discharge to sewers, surface water bodies, and basement sumps
  • Other potential secondary effects may include vapor emissions, enhanced subsurface vapor transport or indoor air volatilization, noise, site disruptions, etc.

Several common illustrations of secondary effects are associated with injection of chemical amendments. For example:

  • In situ chemical oxidation with sodium persulfate may include injection of strong bases such as sodium hydroxide (for alkaline activation of the persulfate) or transition metals such as iron (for iron activation of persulfate). Collectively, these amendments are called activators and produce strong reactive species such as hydroxyl radical and sulfate radical, which can destroy a wide range of contaminants. However, large shifts in groundwater geochemical conditions such as oxidation-reduction potential, pH, and sulfate concentration can result in significant secondary effects, such as effectiveness of treatment, precipitation of inorganics (e.g., metals), and adverse effects to sensitive receptors.
  • The addition of sodium persulfate can affect the natural or anthropogenic chromium present in the soil or aquifer matrix, which may be oxidized to hexavalent chromium, a carcinogen that is soluble and mobile under the oxidizing geochemical conditions. This condition could expand downgradient due to advection of the impacted groundwater. The byproduct of chemical reduction or oxidation is not necessarily the cause of secondary water quality impacts, but the addition of the reagent itself can be. For example, sulfate has a secondary drinking water standard of 250 mg/L (USEPA Drinking Water Standards) The addition of persulfate or magnesium sulfate (Epsom salt), for example, will increase the sulfate load to an aquifer, potentially leading to an exceedance of this standard. Similarly, manganese has a much lower secondary water quality criterion of 0.05 mg (USEPA Drinking Water Standards); therefore this may be a design consideration for permanganate addition near sensitive receptors.
  • The addition of a carbon substrate often will result in methane production when all available electron acceptors have been depleted and excess labile carbon remains (see Section 3.5.2 Fermentation of organic carbon will produce compounds such as acetate and hydrogen, which methanogenic bacteria (e.g., archaea) can directly be used to produce methane under anaerobic conditions (Schink 1997). This can be a concern if carbon substrate amendment is being deployed near buildings because methane is explosive when present as 5% v/v of the surrounding atmosphere (NIOSH 2006). Using an average Henry’s law constant for methane (Sander 1999), the equivalent dissolved gaseous concentration associated with 5% atmospheric concentration is less than 2 milligrams per liter (mg/L). In many cases this may not be an issue, for example, if there are no structures nearby, or if enough vadose zone is present to allow the dilution and degradation of methane by aerobic organisms (methanotrophs) to occur prior to reaching the land surface (ITRC 2011a). Steps should be taken to evaluate the potential for explosion risk in other environments where dilution and degradation cannot occur (e.g., shallow depth to groundwater) or where structures are present that would allow for gas accumulation during carbon substrate amendment applications.

The modeling tools for remedy design summarized in Section 3.3.1 can also be applied to evaluate these secondary effects. For example, PHREEQC, from the U.S. Geological Survey, can be used to assess the potential oxidation and downgradient transport of hexavalent chromium associated with an in situ chemical oxidation treatment.

3.2.3 Coupled Technologies

▼Read more

In situ remediation technologies can be applied simultaneously or sequentially to affect treatment of comingled contaminants; however, the longevity and nature of any lingering conditions that may adversely affect the second technology must be understood prior to full-scale implementation. An example of this is when TCE is chemically oxidized followed by monitored natural attenuation. Chemical oxidation will significantly decrease indigenous microbial populations and recovery of the degrader microorganisms will take time before they can contribute to natural attenuation. The recovery period should be factored into the assessment of whether this combination will meet site cleanup objectives within the necessary time frame. The recovery period may be shortened by addition of amendments and bioaugmentation; however, this would become enhanced in situ bioremediation instead of monitored natural attenuation (Appendix E.14, Naval Submarine Base Kings Bay Case Study). [Please see (ITRC 2011c) section 4.2 for additional information on this topic.] It should be noted that some reagents have an initial remediation process followed by a different process.

3.3 Design Support Elements

This section describes the design elements that are used to support in situ remediation design. These elements are an extension of the CSM and RDC data (see Section 2). The number one source of failure for amendment injection to meet remedial treatment objectives is the lack of an adequately detailed lithologic characterization of the TTZ. A remedial design that minimizes uncertainty often includes a bench study to identify the proper amendment and dosing requirements. This is followed by a pilot study to understand injection rates, distribution pattern around injection points (ROI); (see Section 3.7.1 for a discussion of distribution vs. ROI), and any site-specific conditions adverse to amendment placement (i.e., tendency for amendment to daylight at the injection site or nearby locations) (ITRC 2017a). With these parameters properly understood, the greatest source of uncertainty and failure is the reliance on overly simplified subsurface conceptual models. Design elements used to support in situ remediation design include modeling/analytical tools, laboratory bench testing, and field pilot testing. Each is discussed in the follow subsections.

3.3.1 Modeling and Analytical Tools

▼Read more

Analytical and numerical models for parameter estimation, groundwater flow and transport, and/or geochemical reactions can be used to assist with the design and optimization of in situ remediation. The application of models can range from simple spreadsheet calculations to complex three-dimensional models, depending on the scale and complexity of the remediation project. The selection of a model depends on the question(s) that needs to be answered and the data available to support the modeling effort. Models are one of many tools that can be used at any phase of an in situ remediation project, including development of the CSM, feasibility study, design, implementation, and review of the results. However, not all projects will need to use a model, and the complexity of the model does not necessarily improve the output or accuracy of the model due to the inherent uncertainty when working in heterogeneous geologic systems.

Table 3-1 outlines some of the models that can be used to support in situ remediation projects, provides a brief description of the model, and a source for additional information. Some of the software is public domain and other models are commercially available and require a license. Spreadsheet tools have been developed by many practitioners to support remediation projects. Spreadsheets allow rapid iteration on the design of an in situ remediation program, e.g., assessment of injection duration over a range of flow rates, or calculation of possible lateral transport assuming cylindrical distribution as a function of volume injected and effective porosity. This list is not an endorsement for any of the models, and other models may be available beyond those that are listed here (ITRC 2011c).

Table 3-1 Models that can be used to support remedial design ▼Read more

Model Type of Solution Application Availability
BioPIC Macro-based spreadsheet decision tool Used to evaluate remedial pathways for remediation of chlorinated ethenes. (Lebron 2011)
BIOSCREEN Spreadsheet-based screening model Simulates remediation through natural attenuation of dissolved hydrocarbons at petroleum fuel release sites. The model generates biological attenuation rates under current conditions based on known concentration versus time/location. (USEPA 1997)
CORT3D Finite difference, 3-D reactive transport model based on modified versions of RT3D and MODFLOW Can be used to perform detailed simulations of ISCO treatment. Incorporates DNAPL dissolution, sorption, oxidant-contaminant reactions using second-order kinetics, kinetic natural oxidant demand, and diffusion of oxidant and contaminant. Download Technology Practice Manual. Model is contained in zip file under ISCO Supplemental Info & Tools.

(SERDP 2006a)

Conceptual Design for ISCO (CDISCO) Spreadsheet-based tool that models radial oxidant transport and persistence Can be used to assess the lateral distribution of oxidant from an injection point. This tool was developed for permanganate but could be applied to other oxidants or potentially to amendments other than oxidants. Download Technology Practice Manual. Model is contained in zip file under ISCO E-Protocol for Site Specific Eng & App.

(SERDP 2006b)

Emulsion Design Tool Kit Spreadsheet-based tool For design of distribution of emulsified oil or substrate to promote bioremediation. SERDP n.d.
MODFLOW Family of Codes 3-D finite difference code for modeling groundwater flow and transport Can be used to model groundwater flow and transport, amendment flow, geochemical conditions, variable density flow. MODFLOW and related programs
Natural Attenuation Software (NAS) Software package that provides a decision-making framework for determining the time needed to clean up groundwater contamination sites.
  • Compares times of cleanup associated with monitored natural attenuation to pump-and-treat remediation
  • Expands the kinds and numbers of contaminants considered
  • Allows for concurrent consideration of solvents (chlorinated ethenes) and petroleum hydrocarbons
NAS was developed by the U.S. Geological Survey (USGS).
PHREEQC V-3 Graphical user interface for geochemical computer program (PC only) A computer program for speciation, reaction path, advective transport, and inverse geochemical calculations. USGS – PHREEQC version 3
REMChlor Analytical solution Remediation of either the source zone and/or plume area can be evaluated. Model includes unique degradation rates for parent compounds (e.g., PCE, TCE) and byproducts (e.g., cis-DCE and vinyl chloride). At sites with sufficient data, the model can be calibrated to determine site-specific flow and decay parameters and used to estimate future concentrations with and without remediation. (USEPA 2007)
SEAM3D 3D finite difference Simulation of complex biodegradation problems, including code that can simulate biodegradation, NAPL dissolution, co-metabolic biodegradation, and reductive dechlorination. Report document and code available: (USACE 2000)
Substrate Design Tool Spreadsheet-based model Can be used to estimate amendment mass requirements for anaerobic bioremediation projects. Model incorporates consumption of competing terminal electron acceptors (dissolved oxygen, nitrate, sulfate, etc.) as well as target compounds. The flux into the treatment zone over the design life of the system can be included. (SERDP 2006c)

3.3.2 Laboratory Treatability Bench-Scale Testing

▼Read more

This section focuses on key considerations of how treatability (bench) test results can be incorporated into the design and optimization process. Laboratory bench testing (e.g., bottle/jar test, batch test, column study, microcosms, reactors) has been used to provide proof of concept for the use of in situ treatments since the 1980s. It remains an important tool that can be used to help determine the type and dosing of amendments in situations where the chemistry is complex and/or multiple treatment steps may be necessary. Bench-scale testing is one of many tools that can be used and may not provide added value for all sites. The decision to use bench-scale testing should be evaluated based on site-specific requirements, which could include the scale of the site, project timeline, level of understanding of the contaminants and potential reactions, site chemistry, and/or the need to evaluate alternate treatment options.

Bench-scale testing typically refers to tests that are conducted in batches (e.g., bottles) or to dynamic tests (e.g., column studies). Batch testing typically involves mixing soil with a water-based solution (e.g., groundwater with amendment) and mixing (e.g. agitation, tumbling, continuous stirring) or allowing to sit without mixing. These tests are generally cheaper and of short duration (days to weeks; rarely more than 6 months). Column studies periodically or continuously exchange the water-based solutions and can pulse an amendment followed by an unamended solution or continuously pulse a solution impacted with COCs to look at depletion of an amendment. More detailed experiments are generally conducted over the period of months to evaluate longer term behaviors of a system. Over the full range of bench test level of effort, variables in addition to general configuration and duration can include:

  • solid material (e.g., site soil) that can be used in various methods
  • mixing and homogenization
  • repacked column
  • undisturbed continuous core sample
  • treatment of solids
  • sterilization
  • inoculated with bacteria
  • nonsterilized and noninoculated impacted solids
  • controlled dosing of contaminants onto background solids
  • liquid solution
  • site groundwater
  • water that will be used to mix amendment
  • amendments: Can refer to chemical compounds, natural or synthetic chemical additives, and/or commercially branded remediation products used to achieve desirable physical and biogeochemical conditions within the test environment.
  • buffers
  • biological (e.g., bacteria)
  • activators
  • other constituents
  • pH
  • moisture content
  • soil density
  • aerobic/anaerobic conditions
  • temperature
  • redox conditions

Many decisions go into designing a bench-scale test, such as the number of replicates, how to establish control samples, the test duration, analytical sampling strategy, and how to manage volatilization and/or sorption.

Bench tests generally do not represent field conditions due to issues of scale, field heterogeneity, amendment transport in the subsurface, reaction kinetics, and other physical or chemical characteristics that cannot be captured in the laboratory within project constraints. Despite these limitations, bench test results can provide an initial, screening-level evaluation of potential outcomes, suitability of an amendment for a site, and potential effects of treatment. This information can then be used to inform and optimize the implementation of a field pilot test or field remedial design, and/or provide insight into how to establish a monitoring program for field implementation.

Bench-scale tests should be designed to answer predetermined objectives that are specifically defined by field design unknowns and should support pilot- and full-scale remediation planning. General project objectives that might be effectively addressed through bench testing include:

  • general efficacy of a treatment technology
  • contaminant destruction removal efficiency (DRE)
  • reagents/amendments and associated dosage levels
  • sequential testing of different amendments
  • assessment of a new or alternative process
  • the effectiveness of different activators
  • performance assessment monitoring techniques
  • quantification of potential secondary effects

In designing the bench-scale study, the question, “How will this information improve application in the field?” should be asked to help optimize the tests.

3.3.3 Field Pilot Tests

▼Read more

Pilot tests are small-scale, preliminary field events conducted to evaluate feasibility, time, cost, adverse events, design assumptions, and unexpected responses to generally improve upon the remedial design prior to implementation of a full-scale remediation project.

The complexity and scale of pilot tests can vary depending upon the objectives and requirements. In general, a pilot study plan can be used to guide the pilot test, identify the objectives of the pilot test, and identify the anticipated outcome of the test. The plan can include details on the method for amendment injection, parameters to be monitored during the pilot test, the duration of the pilot test monitoring, and the anticipated results. Developing a plan will help facilitate the evaluation of internal (e.g., injection method) and external (e.g., heterogeneity) factors that affect the test results, and help identify problems with performance.

Pilot tests are generally more representative than bench tests of what can be expected during the full-scale application of a remediation effort because they are performed at the site under site-specific in situ conditions. The primary benefit of a pilot test is to reduce the uncertainty associated with the in situ injection, but it also has the potential to provide cost savings at larger or complex sites. Pilot tests cost more and require more time to implement than bench-scale testing. So the benefits of additional information to reduce uncertainty versus implementing a conservative design will need to be evaluated. Pilot tests are not required for every site. For example, at a relatively small site, the benefit of a pilot test to improve and optimize an injection design is outweighed by the cost of additional mobilizations, sampling, laboratory costs, documentation, and time required to implement, evaluate, and incorporate the results of the pilot into a full-scale design. In these cases, if the CSM and the behavior of the selected amendment are both well understood, it may be more cost-effective to implement a more conservative full-scale design.

The data and information derived from a pilot test should be used to reduce uncertainty and optimize the full-scale injection. For example, the ability to observe the results of the pilot test in a downgradient well could mean that the injection spacing could be farther apart. Therefore, before conducting a pilot study, it can be beneficial to review the type of data that can be monitored and the design parameters that can be specified in the design specifications. Then based on the anticipated site-specific challenges, the pilot plan can include the necessary parameters to be tested, and locations for data collection, to address the design specifications. These can include:

  • injection flow rates versus pressures limitations necessary to avoid surfacing, fracturing, or groundwater mounding
  • demonstration of feasible drilling methods
  • distribution and/or ROI to optimize injection locations to potentially lower drilling costs
  • the ability and time to achieve target depths with proposed drilling technology
  • refusal conditions and how to overcome them, or how to incorporate top of bedrock data into the CSM
  • assessing whether boreholes for packer injection or emplacement can stay open or need to be cased
  • adverse impacts on injection tooling due to difficult drilling conditions
  • the ability of mixing and pumping equipment to effectively mix and inject amendments
  • the ability of the target formation to accept the design injection volume without excess mounding or surfacing
  • a better understanding of seepage velocity versus assumed or measured values
  • residence time of the amendments within the ROI, which is impacted by the groundwater flow rate and biodegradation kinetics
  • evaluation of survivability of bioaugmentation cultures in situations where conditions may be detrimental to survival
  • any unexpected safety considerations

In addition to the parameters that will ultimately be defined as part of the design specifications, a pilot test can also address other concerns that can influence the effectiveness of the treatment rather than just the mechanisms of injecting the amendment. So developing the specific range of objectives for the pilot test will help define the type of information that needs to be collected. For example, depending on the site, it may be beneficial to collect information that allows for evaluation of the:

  • applicability and performance of the remedy in heterogeneous site conditions (Appendix E.9 In Situ Bioremediation and Soil Vapor Extraction at the Former Beaches Laundry & Cleaners Case Study)
  • remedy time frame under real world conditions, reflecting the combined effects of dilution, advective flow, diffusion, adverse chemical interactions, etc.
  • parameters that will be required for the full-scale design
  • dose (i.e., concentration, mass, or volume), frequency, and timing
  • potential geochemical impacts or other secondary effects to the aquifer, such as mobilization of metals or acid production
  • locations and distance from injection points both horizontally and vertically for sampling and performance monitoring
  • amendment distribution vertically within the injection zone and laterally
  • treatment ROI (see Section 3.7.1 for a discussion of distribution vs. ROI)
  • contaminant treatment efficacy and byproduct formation

After injection and during the monitoring period for the pilot test, the data should be evaluated to look for anomalies. For example, if the reaction was expected to release iron, but no iron is detected, what does that mean about the reactions and processes occurring on site? Is the issue related to the time required for the reaction? Does it have any implications for the dose of amendment added? Does something need to be analyzed during the pilot test to help answer these questions? How would the variation from the anticipated results affect the end result?

As the results are scaled up, the data must be carefully evaluated to ensure that extrapolating from a pilot study to full-scale environmental remedy accounts for the inherent variability of the site and other uncertainties. Considerations to evaluate from the pilot test include:

  • optimization of flow rates versus pressures
  • verified distribution and/or ROI (to either increase or decrease planned injection location spacing). If flow rates are lower than expected this can be overcome with manifolding to install additional injection locations simultaneously.
  • logistics associated with larger effort, e.g., water management, amendment delivery and storage
  • pre- and postinjection sampling temporal requirements
  • heterogeneities
  • additional resources
  • time frames
  • equipment (e.g., rental or purchase)

The pilot test results should be used to verify the design elements, process monitoring, and implementation because the pilot test is a field-scale application of the remedy. Some aspects of the design may be specific to the pilot scale (e.g., significantly denser monitoring network and more frequent monitoring); however, in general the information in Section 4.4 applies to both the pilot- and full-scale applications.

3.4 Amendment Selection Considerations

This section offers descriptions of the main amendment types, target contaminants, typical delivery methods, and links to fact sheets from the Treatment Type column in Table 3-2. The fact sheets describe limitations of each amendment, the elements to consider that are design-specific, health and safety issues, references, and some case studies.

The selection of amendment(s) and injection technologies may affect each other and should be considered in an iterative process taking into account site-specific factors such as infrastructure and physical limitations, geology/hydrogeology, and client preferences or regulatory requirements as identified in the CSM. In addition, location of the TTZ (within the source area or the downgradient plume) should also factor into the amendment selection and dosing. The amendment selection information in this section is presented independent of delivery methods. In Section 3.8 (Delivery Strategies), delivery technologies are described and a matrix assists in the consideration of applicable delivery technologies based on site-specific conditions (see Section 3.8).

Differences in treating the source versus treating the plume are critical when selecting amendments. For example, in a source zone, for some amendments, you might consider injecting the amendment at a much higher concentration to deliver more of the reagent in a smaller volume and have a more aggressive treatment. By contrast, in a plume area, you might consider injecting the same amendment at a lower concentration but in a greater relative volume because distribution over a wider area is more important than delivery of a large dose to a small area.

Table 3-2 provides information about amendment types and is organized primarily by treatment processes and treatable contaminants. This allows a user, with a known list of target COCs, to access a suite of applicable amendments and screen out options that would not be appropriate for remediation of the COCs. For instance, a project designer who is looking to use in situ injection technologies to remediate dissolved-phase concentrations of benzene, toluene, ethylbenzene and xylene (BTEX) in groundwater can consult the matrix in Table 3-2 and immediately identify amendments, such as a peroxide compound or other oxygen delivery method, as being more effective than a vegetable oil-based product. The table also describes the function of each amendment (e.g., oxidation, aerobic degradation enhancement compounds, anaerobic degradation enhancement compounds, surfactants, etc.) so that the user can further evaluate the potentially applicable amendments and limit the options to those that provide an appropriate function. The table links to additional information (fact sheets) on suitability for remediating contamination in various media, suitability for treatment of various soil types, cost, expected active lifespan for the amendment, suitability with delivery technologies, advantages over other amendment types, and potential limitations of the amendment.

In many instances the use of a laboratory batch or column test should be considered during the amendment selection process, not only to inform the efficacy of the amendment for a particular project, but also to estimate potential remedial design parameters that will be further refined (e.g., pilot testing). Many amendments blur the lines between biotic and abiotic applications. The amendments are grouped under biotic, abiotic and other additives (Appendix A1 Biotic Amendment Fact Sheets, Appendix A2 Abiotic Amendment Fact Sheets, and Appendix A3 Other additives Fact Sheets), in what we believe are the primary applications, but recognize that any amendment may be considered in multiple sections.

Table 3-2. Amendment types and typical injection/emplacement technologies ▼Read more

Treatment Type Description/Summary Target COCs Typical Injection/Emplacement Technologies Methods
Common Biotic Amendments (A.1)
Aerobic bioremediation (A1.1)/

biological oxidation

Aerobic degradation occurs predominantly in near-surface saturated and vadose zone environments. (Only for sparging. Calcium peroxide does not work in vadose zone). Naturally occurring aerobic microorganisms are widely dispersed, and usually react efficiently with supplemental oxygen provided via bioventing, air sparging, or if necessary, amendments that release oxygen; low to moderate doses of hydrogen peroxide, calcium peroxide, or magnesium peroxide.
  • Petroleum hydrocarbons and some fuel oxygenates (e.g., methyl tertiary-butyl ether [MTBE]).
  • Air/ozone direct injection
  • Air sparging/biosparging
  • Introduction of oxygen via diffused emission
  • Direct vapor phase injection
Cometabolic aerobic & anaerobic bioremediation (A1.2) Co-metabolism involves degradation of contaminants using enzymes produced by microorganisms as a result of consumption of a primary substrate such as methane, propane, ethane, etc. that may be injected into the subsurface. The microorganisms do not benefit from the degradation process and can thrive in the absence of the contaminants. Most co-metabolic processes occur under aerobic conditions and may require oxygen additions to stimulate/support degradation.
  • Chlorinated solvents (TCE, DCE, VC, DCA)
  • Chloroform
  • MTBE
  • 1,4-dioxane
  • THF
  • Explosives
  • Atrazine
  • PAHs
  • Some pesticides
  • Trenching/soil mixing
  • Direct push injection
  • Permanent injection wells
  • Biosparge wells for gases
Anaerobic (A1.3) biological reduction Contaminants are degraded via a reductive process by certain types of microbes under anaerobic conditions. Fermentable organic substrates are injected or placed into the subsurface to enhance the production of hydrogen, which is in turn used by the microbes in the reductive reactions.
  • Chlorinated solvents
  • Many pesticides and munitions
  • Certain inorganic compounds
  • Petroleum hydrocarbons (typically by introduction of electron acceptors such as nitrate and/or sulfate)
  • Direct push injection
  • Permanent injection wells
  • PRBs
Bioaugmentation (A1.4) Bioaugmentation consists of adding microorganisms to the subsurface to enhance and further promote the biodegradation of contaminants under either aerobic or anaerobic conditions. Microorganisms may be cultivated using indigenous populations at the site or using special strains that target specific contaminants.

Note that bioaugmentation may involve aerobic or anaerobic bacteria, and that one or more of the biostimulation methods (e.g., addition of electron donors or acceptors), described above in the bioremediation rows, is typically required for bioaugmentation cultures to be prominent in the subsurface.

  • BTEX
  • Jet fuels
  • Kerosene
  • Chlorinated solvents
  • Certain explosives and pesticides
  • 1,4-dioxane
  • Direct push injection
  • Permanent injection wells
  • Injection wells particularly for PRBs
Abiotic Amendments (A2)
Chemical oxidants (A2.1) Oxidants delivered to the subsurface degrade or transform contaminants via oxidation and reduction reactions in the vadose and saturated zones. Oxidants can be used for source area remediation in conjunction with other compatible remedial alternatives to address downgradient areas with dissolved-phase or lower concentrations. Reaction rates depend on temperature, pH, reactant concentrations, activators or stabilizers, reaction byproducts, natural organic materials, and oxidant scavengers. Activators, stabilizers, and chelating agents may be used to enhance the subsurface oxidation reactions.
  • BTEX
  • MTBE
  • TPH
  • Chlorinated solvents
  • SVOCS
  • Energetics
  • 1,4-dioxane
  • Trenching/soil mixing
  • Direct push injection
  • Permanent injection wells
  • Soil mixing
  • Permeability enhancement (i.e., environmental fracturing)
  • Recirculation
  • Slow-release oxidant cylinder (Evans 2018)
  • Ozone sparging
Chemical reducing compounds for degradation enhancement (A2.2) In general, reducing agents degrade or chemically transform contaminants into potentially less toxic and less mobile forms. The reductive processes depend on the contaminant, the type of reduction, and natural processes in the subsurface.
  • Metals and metalloids
  • Chlorinated solvents
  • Energetics
  • Trenching/soil mixing
  • Direct push injection
  • Permanent injection wells for very fine zero-valent iron (ZVI) products and calcium polysulfide
  • Hydraulic and pneumatic emplacement
Biogeochemical transformation (A2.3) Biogeochemical transformation collectively describes the physical, chemical, and biological processes induced by reduced iron and sulfur minerals, transforming contaminants into nontoxic end products. Multiple transformation pathways often result in full mineralization. Reduced iron is obtained from naturally occurring geological formations, introduced reduced minerals, or microbial activity under anaerobic conditions. Reduced sulfur is obtained from sulfate, is naturally present, or is added with the carbon-based electron donor. It can also be used as a component of MNA under favorable subsurface conditions.
  • Chlorinated solvents
  • Pesticides
  • Explosives
  • Heavy metals
  • Direct push injection
  • Permanent injection wells
  • Trench-based permeable reactor
Activated carbon–based injectates

(A2.4)

The primary mechanism for contaminant reduction using absorptive media (activated carbon) is via adsorption, which may be followed by degradation of the compounds by a secondary process such as reaction with ZVI, ferrous sulfide, persulfate, or biological reactions facilitated by electron acceptors such as oxygen, nitrate, and/or sulfate.
  • Petroleum hydrocarbons
  • Chlorinated solvents
  • Trenching/soil mixing
  • Direct push injection for slurry or colloidal forms
  • Injection wells for fine colloidal forms
  • Hydraulic and pneumatic emplacement
  • Emplacement (soil mixing or trenching) for solid or slurry forms
Surfactants & co-solvents via solvent flushing (A2.5) Surfactant formulations are used to recover free-phase NAPLs via mobilization by reduction of the NAPL/water interfacial tension (surfactant flooding) or via solubilization by formation of micelles that contain droplets of the NAPL or simply by monomer detachment of a contaminant molecule from the NAPL or adsorbed phase. Surfactant formulations include aqueous solutions containing a surfactant and electrolyte, and sometimes a cosurfactant. Often a shear thinning polymer fluid is necessary to achieve high-level mobilization performance.

Solvent flushing involves using low molecular weight alcohols to solubilize and/or mobilize free-phase NAPL.

  • Free-phase NAPLs, including:Petroleum hydrocarbons
  • Chlorinated solvents
  • Coal tar
  • Polychlorinated biphenyls
  • Creosote
  • Permanent injection wells
Other Additives (A.3)
pH Buffers (A3.1) Processes that inhibit pH changes in an aquifer are called pH buffering processes. These processes are important because pH is often a key control on the chemical and microbiological processes responsible for contaminant remediation.
  • Contaminants subject to bioremediation
  • Direct push injection
  • Permanent injection wells
  • Mixing with select amendment
Nutrients (A3.2) In addition to a readily degradable carbon source, microorganisms also require nutrients such as nitrogen, phosphorus, and potassium (N, P, and K) for cellular metabolism and therefore successful growth. Vitamin B12 may stimulate ERD of chlorinated solvents.
  • Contaminants subject to bioremediation
  • Trenching/soil mixing
  • Direct push injection
  • Permanent injection wells
Methane inhibitors (A3.3) In environmental remediation applications, methane inhibitors can be used as a supplement to EISB and ISCR amendments, rendering them safer and more effective.
  • Contaminants subject to bioremediation and in situ chemical reduction
  • Supplied as a water-soluble powder that can be mixed on site and added in conjunction with the electron donor (or as a component of some electron donor formulations) before injection through permanent injection wells or temporary push points.

3.4.1 Combined Remedies—Spatial and Sequential Remedies and Mixed Contaminant Options

▼Read more

Some plumes have a mix of contaminants, some of which are susceptible to oxidation and/or aerobic bioremediation and others of which are susceptible only to reduction and/or anaerobic bioremediation. There are several options for treatment of these plumes, including combining remedies either spatially, where the sources or plumes may not overlap, or where one is treated in one area and the other downgradient; or sequentially, where one is treated followed in time by treatment of the other contaminant type. Secondary effects of remediation amendments (see Section 3.2.2) are key considerations when treating mixed contaminants since the effects need to be taken into consideration for multiple remediation approaches. Examples of this combined remedy approach include:

  • reductive treatment with electron donors to reduce chlorinated solvents followed by aerobic polishing of the petroleum hydrocarbon (either in the same treatment zone or downgradient)
  • aerobic biodegradation or in situ chemical oxidation treatment of the petroleum followed by substrate and bioaugmentation culture injections and pH adjustments to promote anaerobic bioremediation
  • activated carbon–based injectates inoculated with microbes and/or nutrients to enhance the colonization of the activated carbon with microbes

3.5 Amendment Dose Requirements

Several sequential steps are typically required to estimate the amount of amendment that must be injected for any remedial design. Amendment dose here is used broadly to be applicable to volume, concentration, addition rates, and mass. Another consideration is the persistence of the amendment (e.g., electron donors such as lactate that are completely miscible with groundwater versus donors such as emulsified vegetable oil that stick to the geologic media and are dissolved/released slowly over time). The first step is to define the size (e.g., volume and contaminant mass) of the TTZ (see Section 3.2.1). The second step is to evaluate the background demand for the amendment, which reflects the amount of amendment required to establish and maintain the appropriate conditions for optimal remedy performance. The third step is to evaluate the target demand for the amendment, which reflects the amount of amendment required to destroy the target contaminant. An approach is outlined in this section to estimate the total amendment requirement for the TTZ. The amount of amendment required per injection point, or other distribution mechanism, is a factor of the delivery method, which is addressed in Section 3.5.3, and degradation kinetics for the amendment.

3.5.1 Background Demand

▼Read more

Amendments injected into the subsurface are generally intended to alter the ambient conditions in the treatment area to achieve the desired reactions with the contaminants. The amendments therefore react in some way with the soil and groundwater constituents (in addition to the target contaminants) to establish and maintain the desired condition. The amount of amendment required to address this demand is referred to as the background demand. The reactions associated with the background demand do not necessarily prevent the desired reactions between amendments and target compounds from occurring, but rather represent an amendment requirement that is in addition to the amount specifically required for reactions that transform the target contaminants. The background demand is often much higher than the target contaminant demand; in some cases, the background demand (particularly for oxidants) can be so high that a remedy becomes impractical due to technical or cost constraints. Thus, it is important to assess the background demand and incorporate it into the remedial design. Bench tests are commonly used to evaluate the background demand (see Section 3.3.2).

Background demand encompasses several types of processes depending upon the type and form of the amendment. A liquid or gaseous amendment will permeate through a soil matrix and interact with the surfaces of the soil particles. If the amendment is delivered to the saturated zone, it may also interact with constituents dissolved in groundwater. With liquid or gaseous amendments, it is therefore important to consider reactions with both soil solids and with groundwater, although in practice the soil often exerts a much larger background demand than the groundwater. An example of this type of background demand is natural oxidant demand. In other cases, if the amendment is delivered in a solid form such that migrating groundwater reacts with the surface of the solid amendment particles (for example, with ZVI), the background demand from reaction with the groundwater is generally more significant than from reaction with soil. An additional factor to consider for longer term processes is the potential for ambient groundwater flow to transport additional reactive constituents into the treatment zone.

Special consideration must be given to background demand for amendments that rely upon catalytic reactions, or for which other amendments are used as stabilizers or conditioners. An example of this type of system is catalyzed hydrogen peroxide for ISCO. Hydrogen peroxide will readily form surface complexes and react with transition metals such as iron on mineral surfaces. Therefore, practitioners often inject other amendments with the hydrogen peroxide to achieve a desired pH range or to stabilize the hydrogen peroxide reactions, which may change the background demand. Care must be taken to account for reaction conditions in the case of complex amendment mixtures.

Bioremediation amendments also have special considerations for background demand assessment. Background demand for bioremediation amendments reflects the availability of the amendment for biological metabolic reactions, the presence of appropriate microbes to metabolize the amendment, and biological reactions with competing electron acceptors (for anaerobic systems) or donors (for aerobic systems). Competing electron acceptors for anaerobic bioremediation amendments provide an example. Competing electron acceptors present in groundwater are typically consumed (microbially reduced) in a very predictable order: first dissolved oxygen, then nitrate, manganese, iron, sulfate, and carbon dioxide (see Section 2.3.5.2). Iron and manganese may be present as solid-phase minerals in the aqueous phase and can be available as electron acceptors. When designing anaerobic bioremediation injections, the design should consider both the electron acceptors that are initially present in the treatment zone and those that will flow into the treatment zone with ambient groundwater flow. Several software tools are available to help with estimation of background demand, particularly for bioremediation applications (see Section 3.3.1).

3.5.2 Target Demand

▼Read more

The contaminant mass and distribution can exert a significant amendment demand or a negligible demand (relative to the background demand) depending upon the remedy and site characteristics. With bioremediation remedies, once the initial background demand is met, any additional amendment demand predominantly reflects the demand to maintain those conditions throughout the treatment period—for example, additional electron acceptors or donors that migrate into the treatment area with groundwater flow or consumption by microbial population. In this case, there is no direct reaction between the amendment and the contaminant, and the contaminant mass primarily affects how long the bioremediation conditions must be maintained (i.e., how long must the background demand continue to be met) for the microbial activity to destroy the contaminants.

With chemical oxidation and reduction remedies, the amendments typically react directly with the contaminants, and thus the contaminant mass or concentration must be considered. In the case of chemical oxidation, the total amendment demand is often arrived at by estimating the background demand as outlined in Section 3.5.1, and then estimating an additional demand based upon the amount of oxidant required to destroy the target contaminant mass. With some remedies the reactions involved are not instantaneous, and thus the contaminant concentration and a residence time in the treatment zone are factors to consider for amendment demand. An example of this is ZVI chemical reduction in a permeable reactive treatment zone (PRTZ) remedy. Reaction rates for many contaminants with ZVI are sufficiently slow that half-lives may be measured in minutes or hours. The number of half-lives (and therefore the residence time, and the corresponding amount of amendment required) is a function of the concentration of the contaminant flowing into the treatment zone and the desired concentration flowing out of the treatment zone.

The distribution of the contaminant between groundwater and soil, and between high and low permeability zones, must also be considered in the amendment requirement. For example, even if soil contaminant concentrations meet the treatment objectives but groundwater concentrations do not, then the amendment requirement must continue to reflect both the groundwater and soil mass because the contaminant desorption from the soil may continue to impact groundwater.

Injected liquid amendments will preferentially flow through relatively transmissive zones within a formation. In late-stage plumes, much of the contaminant mass may be present in less transmissive zones and the remedy must account for long-term desorption (back-diffusion) from the less transmissive zones, resulting in longer periods of treatment, which translates to a larger background demand.

3.5.2.1 Examples of Amendment Requirement Estimation Methods

Several different methods can be used to estimate amendment requirements. The overall framework is to estimate the amendment requirement based upon the volume and characteristics of the TTZ coupled with the demand from both background and contaminants within that TTZ. A quantitative approach is commonly a more effective basis for an initial estimate, which can then be refined and optimized based upon experience and/or pilot test results. Software modeling and amendment estimation tools are also available (see Section 3.3.1). Three methods can be used individually or in sequence:

  • Method 1: Stoichiometric plus background calculation. The total amendment requirement is the sum of the demand from reaction with the estimated contaminant mass (e.g., from a stoichiometric degradation reaction) plus the demand from competing side reactions, such as with transition metals and/or natural organic carbon in the subsurface. This method is limited by the accuracy of contaminant mass estimates and the reactivity of the compounds that account for the competing side reactions.
  • Method 2: Experienced based. Apply amendment loading rates that have been successful at other sites with similar geology, geochemistry, and plume characteristics. Although not as quantitatively supportable as Method 1, practitioner experience should not be discounted as an effective method to evaluate amendment requirements. However, all in situ remediation designs should be site-specific. Additionally, because many historical in situ remediation designs have not led to attainment of target end points, extreme care should be taken that practitioner experience that led to past failed application should not be the basis for future design.
  • Method 3: Pilot test results. Perform a pilot test with an amendment dosing based on one of the above methods and use the resulting process and performance data to evaluate amendment requirements for future injections or a full-scale remedy.

Each of the methods outlined above is subject to significant uncertainty, thus incorporating a safety component is often prudent with amendment requirement estimates. After arriving at a conceptual design with one or more of the methods outlined above, evaluate the need for an additional safety factor to account for uncertainties such as degree of heterogeneity, accuracy of bench- and pilot-scale testing to full-scale site conditions, etc. (see Section 3.3.3). Amendments are the component of the remedy that ultimately result in subsurface treatment; however, amendments are often a relatively small component of overall project cost relative to other project management, labor, mobilization, equipment, and other costs. Read less

3.5.3 Volume Considerations

This section describes how to determine the overall volume of amendments, usually diluted in water that should be delivered. The considerations are fundamentally different depending on if the remediation program is designed to deliver a soluble amendment through pore space (injection of liquid) or to modify the subsurface permeability by pressurized application of a slurry (injection of a solid). Given these differences, discussion of volume delivered is subdivided below for injection of liquid versus injection of solids.

3.5.3.1 Volume for Liquid Injection

▼Read more

The volume of a liquid amendment injected is perhaps the most important design parameter because the volume injected is closely related to the degree of contact between the amendment and contaminants that occurs in the subsurface. In situ remediation case study reviews (Appendix E) have repeatedly found that injection programs are often under-designed with respect to the total volume injected. Therefore, high-level calculations of the total volume of fluids to be delivered should be performed as outlined in this section.

The basis for the calculations is the total volume of effective pore space in the TTZ. The effective pore volume (ePV) is calculated by multiplying the volume of the TTZ by the effective porosity. Effective porosity values can be estimated from the literature based on soil type or from site-specific predesign testing. When treating heterogeneous geology, the effective porosity of the treatment zone should be weighted based on the effective porosity of the high K (permeability) strata and the relative proportion of those strata unless the injection points will be installed such that screens do not intersect both high and low K zones. Using injection wells as an example, wells screened across a silt and sand layer will have the vast majority of flow through the sand. Therefore, the effective porosity relevant at the scale of the well screen would be calculated by the effective porosity of the sand times the proportion of the sand to the total well screen. Conversely, if nested well pairs are installed screened only in sand and only in silt, the effective porosity of the silt should be considered in the treatment zone effective porosity value.

The volume of fluid to be injected should be calculated in terms of fraction of the treatment zone ePV. For example, if an ePV is 100,000 gallons and the design specifies injection of 40,000 gallons, the design therefore specifies 0.4 ePVs. The fraction of an ePV to be injected can be thought of as the fraction of effective pore space in which groundwater will be physically replaced with reactive amendment—in the preceding example, 40%. Additionally, when less than 1.0 ePV is specified, the remaining pore space is (1) treated by ambient advection of amendment as a result of natural groundwater flow; (2) treated by diffusion of amendment; or (3) is not contacted by amendment (i.e., remains untreated). In our example, 60% of the treatment zone effective pore space would not be contacted by amendment as the result of initial injection but could be achieved through ambient advection as long as the amendment persists for the time it takes to achieve the design ROI. Limitations of injection of a relatively high percentage of ePV are identified in Table 3-3.

Table 3-3. Benefits and challenges of high ePV injections

Benefits of High ePV Injection Challenges of High ePV Injection
Greater contact between amendment and target contaminants and less reliance on ambient advection and diffusion. Increased time/cost associated with injection of a greater volume of fluid, possibly resulting in injection at higher flow rates that could fracture the TTZ.
More penetration of amendment into lower permeability material if amendment is persistent enough to allow for diffusion into low K zones. Increased potential for displacement of impacted groundwater vertically (e.g., daylighting) and/or laterally outside the treatment zone.
Less reliance on diffusion or ambient advection of amendments. Critical to achieve overall ROI in low seepage velocity sites. Increased potential for transport of amendments to unintended locations without hydraulic control. Achieving required treatment residence time in high seepage velocity sites.

The density of the injected fluid, if greater than that of the groundwater, can cause vertical migration of the injectate. Where there is a high degree of vertical stratification this may not be critical, but can cause the loss of amendment solution to zones deeper than the TTZ. If the injection fluid is less dense than the water (e.g., neat oils as carbon sources), there may be a buoyancy effect that again displaces the amendment into untargeted zones.

Multiple reviews of field-scale in situ remediation case studies have found that practitioners typically inject small volumes of fluids relative to the total pore space in the treatment zone (PERF 2013). (Suthersan 2017) determined that ISCO programs typically do not “inject adequate volume of chemical reagent to achieve sufficient distribution and contact” with target compounds. (Clayton 2007; Krembs 2010) found that 40% of ISCO case studies injected the equivalent of 0.01 ePVs or less (i.e., nearly half of the 27 case studies reviewed injected a volume less than 1% of the pore space in the treatment zone). (Krembs 2010) found that among sites where ISCO was used to treat PCE or TCE, the average number of ePVs injected was 0.5 for sites that achieved >90% reductions in target compounds (i.e., successful sites) versus an average of 0.24 ePVs at sites that achieved <90% reductions. This finding highlights the link between volume of fluids injected and the performance results attained.

3.5.3.2 Volume for Solid or Slurry Injection

▼Read more

Injection of a solid by intentionally altering the subsurface permeability (i.e., fracturing) is fundamentally different from injection of amendment through existing pore space. When injecting solid amendments, the total volume delivered is generally a much lower percentage of the total volume of the TTZ. Rather than specifying the total volume of fluids to emplace relative to the total pore space (method outlined for injection above), solid or slurry injection-based programs are designed based on how far apart materials can be delivered from each fracture. (Appendix D5–Hydraulic Fracturing-Based Delivery Methods)

Once the injection details are defined (i.e., number of points and volume per point), it may be helpful to calculate the percent of ePV that is being proposed. The remainder of the treatment zone must then be contacted by diffusion or natural groundwater flow, which can be slow processes. For example, if a solid injection design results in injection of 0.02 ePVs, the design relies on diffusion and natural groundwater flow to treat the remaining 98% of the treatment zone (see the following section for additional discussion of advective distribution versus natural groundwater flow versus dispersion). The success of such a design depends on diffusion distances, groundwater flow rates and flow paths, and the persistence of the amendment in the subsurface.

3.5.4 Amendment Persistence

The persistence of an amendment is based on the reagents (individual chemicals or component) that are used to make up the amendment and the amendment dose. Some very soluble or aqueous amendments, and the resulting benefit or reactions generated by the amendments, may persist for days, weeks, or perhaps a few months, due to the reactions and processes that consume the amendments. As a result, additional amendment injection events may be necessary to sustain an effective treatment. Examples of soluble amendments include certain organic carbon substrates such as lactate, certain chemical oxidants such as hydrogen peroxide, or a pH buffering aqueous solution such as sodium hydroxide. Other amendments are insoluble or sparingly soluble, and after emplacement will slowly release (via dissolution, hydrolysis, or other processes) dissolved-phase amendments over a much longer period of time, ranging from months to years or potentially decades. As a result, a desired subsurface geochemical condition or treatment zone can be maintained for a much longer period of time without additional injection. Many types of amendments are available in both very soluble and more insoluble forms (for example, sodium permanganate [soluble] and potassium permanganate [less soluble]), which provides flexibility and optimization of remedial designs for site-specific conditions.

3.6 Amendment Delivery Optimization

There is typically a trade-off between the number and spacing of direct push points/injection wells and the volume of amendment injected per point or well. There will likely be constraints on the budget, injection pressure, site access, time for implementation, and available mixing and distribution logistics and equipment. This represents an optimization opportunity where the minimization of cost or time needed for the successful completion of the project is subject to those constraints. The optimization may initially consider the trade-off of cost vs. time (see Section 2.1.2) and/or certainty of successful treatment for different delivery strategies (e.g., inject and drift vs. recirculation) (see below). Optimization may be more applicable, however, to the refinement of the number and spacing of injection points, injection transects, and recirculation wells for minimization of cost or time using one of the delivery strategies.

There are advantages and disadvantages to both direct push injection and injection wells. Injection wells are often used if there is a plan to do multiple rounds of injection over time or if long-term amendment addition is planned, because once installed, there is less need for remobilization of the more expensive equipment such as drill rigs. However, there is less flexibility with injection wells compared with direct push points because the injections occur over the same depth interval at the same location for each round. If direct push injections are used, there is flexibility to target hot spots or areas of rebound or to target different areas or depth intervals on subsequent rounds of injections, and there is less chance of fouling of the screen interval that can occur with injection wells over time. Consideration must be given to the planned duration of injections, access constraints, maintenance requirements, and the expected need for flexibility in injection layout over time when determining which injection method is preferred.

The optimization analysis requires information on the unit costs and time necessary for all activities related to the injection project, including well installation or direct push injection, field labor, sampling and analysis, equipment rental, storage of amendments and equipment, etc. The analysis also requires estimates of the time necessary for transport or delivery of amendments into and through the subsurface, given the hydrogeology of the site. Modeling and pilot testing will provide information on these aspects. As previously discussed in Section 3.5, the behavior and persistence of the amendment once injected must be understood and estimated. See Figure 3-2 for four examples of amendment persistence under natural flow (see Section 3.8). Finally, the client’s time and budget constraints, as well as other site physical and access constraints, must be considered.


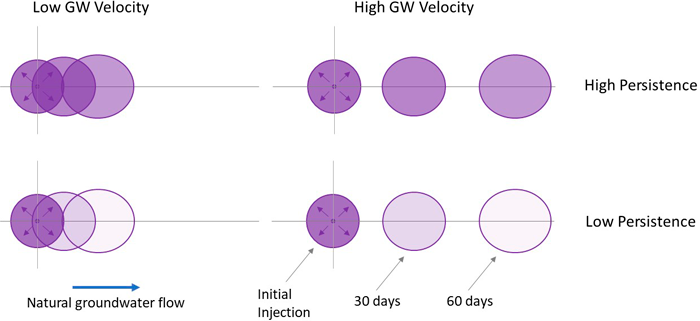
Figure 3-2. Amendment persistence at natural flow using four scenarios.
Source: Graphic used with permission from Trihydro Corporation.

Each example in Figure 3-2 shows a plan view of one injection point, with natural groundwater flow transporting the amendment away from the injection location. The distribution of the amendment is shown over time, with lighter shaded circles indicating that the amendment is depleted or less effective. In areas with low groundwater flow, the amendment will be depleted before it can be transported downgradient. In an environment with higher groundwater velocity, the amendment is distributed farther from the injection point before it loses effectiveness

With this optimization analysis information, the cost and treatment time for different injection point/line spacing can be estimated. The costs included in the analysis should include the added monitoring, labor, reporting, etc., that would be necessary for a longer remedy implementation period and not just the time needed for the amendment delivery. The combination of injection point, line spacing, and amendment volume per point with the minimum time or cost that meets the project constraints would be preferred. Some assessment of the uncertainty in the success of the implementation is necessary to allow for some factor of safety in the selected design. An optimal arrangement is usually one that is very close to violating one of the constraints, so some conservatism is needed in the selected design.

Optimization can also be applied to the determination of the TTZ, when multiple technologies are used in different portions of the site or at different times (see Section 3.2.3). The optimization can be done in a way to achieve the fastest or least expensive overall remediation through a trade-off between the boundaries or timing of the various applications.

Formal optimization tools, when used with models, can automate the process of constructing the relationships between design parameters and cost and time. (see Section 3.3.1 for more information on modeling)

The strategy of amendment delivery refers to the high-level approach that will be applied to the TTZ. For example, for a TTZ within a predominantly low permeability geology, injection rates should reflect the geology (e.g., lower flow rates with a control on the injection pressure) to prevent unintentional fracturing, short-circuiting, or daylighting. Considerations include the desired outcome (e.g., source treatment versus mitigation of off-site impacts) and the amendment distribution mechanisms that will be used during and after delivery. Several types of strategies are described below and in Figure 3-3.

  • Grid pattern: Perhaps the most common method of delivery is to space delivery locations uniformly over the treatment zone and to deliver amendment at each of these locations. This approach is based on (relatively) uniform delivery of amendment away from each delivery location and does not intend to leverage postinjection processes, such as adjective flow, to distribute the amendment within the TTZ. This approach is the most broadly applicable, i.e., there are very few site-specific constraints that would challenge this method.
  • Inject and drift: This strategy leverages distribution of amendment with natural groundwater flow (the advective phase). The spacing of delivery locations is greater in the direction parallel to groundwater flow. This method is applicable in situations in which the amendment is soluble in water, groundwater velocities are relatively high, and/or the amendment is relatively persistent in the subsurface.
  • Recirculation: This strategy consists of simultaneous injection and extraction of groundwater. This strategy can increase the lateral extent of amendment influence and reduce the risk of daylighting of amendment. Use of this strategy is typically limited to sites with relatively high transmissivity. Extraction and reinjection of contaminated groundwater can pose regulatory challenges, though (USEPA 2000) clearly stated that addition of an amendment that will result in treatment meets the requirement that contaminated groundwater be treated even if that treatment occurs after reinjection.
  • Barrier: This strategy consists of delivery in a linear transect such that contaminated groundwater flows into the treatment zone where it is treated. Such strategies use a barrier to contaminant migration, but not to groundwater flow. Barrier strategies are applicable to continuous delivery systems (e.g., ozone sparging) or to sorptive or insoluble amendments.

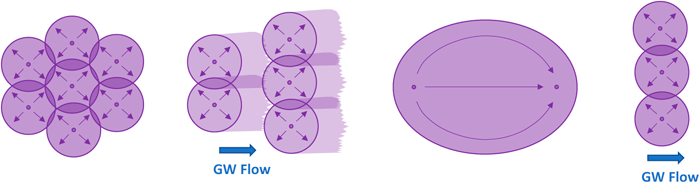
Figure 3-3. Plan view of amendment delivery strategies (from left to right: grid pattern; inject and drift; recirculation; and barrier). Note that these graphics are schematic depictions and are not to-scale; in general, ROI are not circular or smooth-edged but variable due to heterogeneities in the subsurface. Barrier strategies may typically require double rows of delivery points, and recirculation systems often use more than a single injection and extraction well. For high seepage–velocity sites, distribution is less circular and more elongated and the lateral, cross-gradient extent of ROI at the injection location may not be achieved.
Source: Graphic used with permission from Trihydro Corporation.

3.6.1 Overcoming Delivery Problems

Several factors can prevent optimal distribution of amendments. Poor estimates of required injection pressures or injection at higher than design rates to overcome poor distribution can prevent optimal amendment distribution or create preferential pathways, thereby not achieving uniform distribution in the TTZ. Fouling of the distribution pathways through biofouling, formation of inorganic precipitates, or gas build up reduces the permeability and can result in nonuniform distribution in the TTZ. Generally, fouling is a process in which a well screen, filter pack, and/or the surrounding formation become clogged over time. Fouling is most common for fixed injection wells, rather than direct push injection (DPI) (which can be repositioned if an area becomes fouled), especially if multiple injection events are required.

3.6.1.1 Injection Pressure versus Flow Rate

▼Read more

A key relationship specific to injection-based technologies is injection pressure vs. flow rate. The injected amendment will displace groundwater already present in the effective porosity. This requires the application of pressure during the injection process to overcome the general resistance to fluid displacement. This can be exacerbated by a variety of factors, including the presence of confined or semiconfined layers, which will act as a roof or floor to the injection, preventing any upward or downward vertical groundwater displacement during the injection process. In these instances, it can be tempting to increase injection pressure to increase the injection flow rate; however, this creates a high risk of physically fracturing the matrix. If this happens, injection pressures will decrease, and injection flow rates will increase. Although this may have accomplished the desired outcome of increasing the rate of injection, many (or most) times this actually leads to delivery of the amendment to an unintended interval. Examples of this include surfacing of fluid during injection (daylighting) or delivery of the amendment to the vadose zone or other interval not intended for treatment (i.e., does not contain the targeted contaminants) (Appendix E.6, Oxidant Surface Eruption During Direct Push Injection). The recommendation is for precise control of injection flows and pressures to not exceed design distribution specifications throughout the entire injection process from flow initiation to ongoing injection.

Several different delivery strategies can be deployed to help overcome some of the physical limitations of injections. These strategies, which can decrease the unintentional risk of formation fracturing, are discussed in detail in Section 3.8.

3.6.1.2 Biofouling

▼Read more

Biological fouling of wells can come in many forms, including slimes or biofilms, foams or pastes, and can accumulate on well screens, within the well filter pack, within the formation outside the filter pack, or on sampling and amendment delivery equipment. Biofilm production is a process in which bacteria adhere to a surface through a variety of natural forces and then reproduce to form colonies (ESTCP 2005b). The same processes that promote remediation also stimulate microbial growth and gas generation within the injection wells and remediation system infrastructure.

3.6.1.3 Fouling by Inorganic Precipitates

▼Read more

The formation of inorganic precipitates can occur in the subsurface due to in situ treatment. Common changes in the subsurface resulting from a candidate treatment, which may induce inorganic fouling, may include, but not be limited to, oxidation-reduction potential, dissolved oxygen, pH, solubility, and sulfate concentration. Considerations to the potential changes can effectively be addressed and evaluated during the bench- and pilot-scale activities (Sections 3.3.2 and 3.3.3). If during pilot testing, scaling and precipitation of metals onto the well screen occurs, consideration should be given to using DPI over fixed wells for the full-scale remedy.

Other interactions with ions present in the groundwater and injected amendments may cause fouling over time. For example, the long-chain fatty acids derived from vegetable oil-based substrates may react with divalent ions such as calcium and magnesium dissolved in groundwater to form an insoluble precipitate in well screens and filter packs that is similar to soap scum.

3.6.1.4 Gas Fouling

▼Read more

Fermentative gases generated from anaerobic microbial metabolic activities (for example carbon donor EISB applications) will occupy aquifer pore space and at least temporarily reduce hydraulic conductivity of the aquifer (Burnell 2013). These gases also create potential safety concerns as pressure backs up in fixed injection wells, such that the well cap could become a projectile. Buildup of aquifer gases also has the potential to yield erroneous water level readings, and it is important to vent monitoring wells before collecting or drill a vent hole to allow gases to escape. Further health and safety concerns associated with gas fouling of both injection wells and monitoring wells include the flammability of methane and the displacement of oxygen in the breathing zone.

3.6.2 Prevention and Control of Biofouling

▼Read more

There are several strategies to prevent, limit, or control biofouling associated with EISB  (ESTCP 2005b). Arguably the most effective stage for addressing biofouling is at the characterization and design phase, although physical and chemical well rehabilitation strategies are available after implementation. Although well rehabilitation using physical methods (e.g., scrubbing, surging, jetting), chemical methods (e.g., acid, chlorine) or other methods (heat, cold, ultrasound) are possible, the effectiveness is limited, they provide only transient improvement in well performance, and once fouling has started it can be difficult to control and rehabilitation will require repeated applications. A potentially more effective method of biofouling control is preventive biofouling controls such as the continuous or batch additions of chlorine dioxide, hydrogen peroxide, or other agents to prevent the formation of biofilms in the well screens (ESTCP 2005b). Selection of biofouling prevention agents needs to take into consideration the remedy and potential interferences from the biofouling agents (redox, toxic effects, etc.). Another option is batch dosing the amendment at high enough concentrations in the wells that the amendment concentration is toxic to the bacteria, and allowing natural gradient or the groundwater recirculation system to dilute the amendment out in the ROI.

Consideration should be given to using DPI points versus permanent wells and/or recirculation systems if biofouling is expected to be a significant concern see Section 3.6.2.1). There are many pros and cons of using direct push technology (DPT) versus wells for injection of amendments that are addressed further in Section 3.8, Delivery Strategies, but one of the advantages is that a DPI point is usually temporary enough that no biofouling will occur around it.

3.6.2.1 Design Considerations

▼Read more

Prevention of biofouling in wells used in delivery or monitoring is achieved by having a solid understanding of hydrogeology and contaminant distribution. Major factors to consider at the design stage that are likely to cause future fouling problems include total organic carbon, metallic cations, phosphorus, nitrogen, and the integrity of the surface seal to withstand injection pressures (USACE 2003). A thorough site characterization is also essential for limiting amendment volumes so that the site-specific electron donor demand is met and not exceeded (ESTCP 2010b). In doing so, monitoring wells are less likely to be influenced by microbial growth or the amendments themselves. Design-based characterization is discussed in Section 2 of this document. Because biofouling is often observed during EISB, remedial plans should include a well monitoring and maintenance plan to identify the occurrence and mitigation strategy of biofouling. Such a plan may include both physical and chemical well and infrastructure rehabilitation methods. Flushing the injection lines and well screens after substrate injection for EISB will reduce amendments in the wells and help to minimize biofouling or separation of products such as emulsified vegetable oil (Appendix D6–Pneumatic Fracturing-Based Delivery Methods).

3.6.2.2 Operational Strategies

▼Read more

Both performance monitoring and the rehabilitation process can be used to minimize fouling. Injection wells should be monitored periodically for wellhead pressures, depth to water, static water levels, injection flow rates, and volumes so that any losses in injection capacity are quickly identified. Visual inspection of the well screen (e.g., downhole camera) is also valuable for identifying the presence and severity of biofouling in both injection and monitoring wells. The frequency of monitoring events should be designed such that fouling issues are recognized quickly and can be mitigated. Various operational strategies can be used, including:

  • flushing wells postinjection of electron donors
  • mechanical well rehabilitation
  • chemical well rehabilitation

Well rehabilitation methods are described in A Review of Biofouling Controls for Enhanced In situ Bioremediation of Groundwater, October 2005.

3.7 Delivery Layout Design and Volume per Location

This section describes the methods for determining the number of delivery locations, their spacing, and how much volume to deliver at each location. The text in this section assumes that the following data have already been generated: RDC data (see Section 2); the preferred amendment type and general delivery method that emerged from screening (see Section 3.4); the definition of the TTZ (see Section 3.2.1); the mass of amendment required (see Section 3.5); the strategy for amendment delivery (see Section 3.6); and the overall volume of fluid to be delivered (see Section 3.5.3).

The number and spacing of injection locations should be based on the overall goal of achieving adequate distribution of amendment throughout the TTZ. Amendment will travel through the subsurface through the following processes subject to the constraints listed below.

  • Advection as the result of pressurized delivery, i.e., physical displacement of pore water (for injection) or formation of new porosity as the result of fracturing (for emplacement). The primary constraints on advection during delivery are: (1) preferential flow through higher permeability zone, and (2) limitations on the volume injected and amount of time allotted for delivery. Transport of many amendments will be greatest during active injection.
  • Advection due to natural groundwater flow, which can transport amendments additional distances after active delivery ceases. Constraints on ambient advection are: (1) the rate at which the amendment is depleted in the subsurface, (2) the propensity of the amendment to move with the groundwater or adhere to soil surfaces, and (3) preferential flow through higher permeability zones. The choice of the amendment will also impact the distribution. Soluble substrates should distribute farther than fine particles of emulsified vegetable oil (EVO) or large-scale particles of ZVI. The nature of the amendment will also impact transport, with nonionic particles less likely to react with charged soil particles than charged amendment particles.
  • Diffusion as the result of concentration gradients, which is constrained by (1) amendment depletion in the subsurface, and (2) slow rates of diffusion.

3.7.1 Number of Delivery Locations and Volume for Injection of Liquids

▼Read more

The process of defining the number of delivery locations and the volume to be delivered at each location is typically an iterative process. For simplicity, this section assumes that delivery at each point will be the same, i.e., same volume and same intended ROI. In reality this is not always true as variations in geology and hydrology may vary within a few feet. The amendment is delivered at specific locations and travels outward from these locations, ideally throughout the rest of the TTZ. Determination of the number and specific locations for delivery of amendments is based on an assessment of how far the amendment will go (ROI), which is in turn a function of how much volume is delivered.

3.7.1.1 Desired Radius of Influence

The first step is to determine the desired ROI. The term “ROI” can be misleading because it implies uniform distribution in each lateral direction and at each depth. In the design of the pilot study and/or field implementation of a remedy, the ROI can vary vertically as well as laterally. Appropriate consideration should be given to adequately plan an effective pilot study/remedy by using ranges of ROI. Geologic heterogeneity results in preferential flow through higher permeability zones. Unconsolidated (sedimentary) geologic deposits are stratified vertically, thus preferential flow occurs as a function of depth. This is shown graphically in Figure 3-4. Both panes show delivery of approximately 0.1 ePVs of amendment. The less heterogeneous case (left) results in delivery of amendment in the vicinity of each of the delivery points. The more heterogeneous case (right) results in substantial variability in lateral influence versus depth. Figure 3-4 shows photographs of heterogeneous and homogenous dye delivery (Clayton 2008).


Figure 3-4. Cross section view of heterogeneous oxidant transport (graphic used by permission from Trihydro Corporation, modified from (Clayton 2008) presentation “In situ Chemical Oxidation (Basics, Theory, Design and Application)” presentation to California DTSC Remediation Technology Symposium, May 14-16.
Source: Photographs by W. Clayton, Trihydro. Used with permission.

Photographs of heterogeneous and homogenous delivery are shown in Figure 3-5, including heterogeneous delivery of dye tracer with lateral direction from injection points (left, picture taken looking down into pit) and relatively homogeneous permanganate distribution in a sand as a function of depth (right, picture taken after soil cores have been removed from subsurface, showing the permanganate distribution at various injection depths).

Figure 3-5. Heterogeneous and homogenous delivery of dye tracer.
Left image shows heterogeneous delivery of dye tracer with lateral direction from injection points (picture taken looking down into pit). Right image shows relatively homogeneous permanganate distribution in a sand as a function of depth (picture taken after soil cores have been removed from subsurface, showing the permanganate distribution at various injection depths). Photographs by E. Cooper, Cascade Environmental, used with permission.

Once the desired ROI has been determined, the next step is to assess how injection should be designed to attain this ROI. If a pilot study has been performed, the site-specific data generated should be used in this assessment (see Section 3.3.3). However, heterogeneous geologic conditions invariably result in some amount of preferential flow as a function of depth and radial direction. The equation for the volume of a cylinder (V= π*r2*h) is nevertheless a starting point in evaluating the relationship between injection volume and how far the amendment might travel laterally during delivery (see Section 3.5.3.1). Modeling tools can also be applied during this assessment (see Section 3.3.1). Practitioner experience can be brought to bear, but with some caution. Experience at other sites is applicable only to the degree that the subsurface conditions at the other sites are similar to the site in question. Additionally, just because a practitioner used an approach at other sites does not necessarily mean that those other sites were successful.

The desired ROI is often influenced by the dimensions of the TTZ. For example, if a plume is 3 m wide, a lateral influence in the range of 1.5–2 m should allow treatment of the entire width of the plume. For this 3-m wide plume, a lateral influence of 3 m would result in substantial delivery of amendment beyond the limits of the plume. A lateral influence of 1.2 m or less would require multiple delivery points per row to treat the entire width of the plume. Additionally, surface or subsurface features may dictate the distance of influence as well. The assumption is that all delivery points are straight and completely vertical. Rocks and other heterogeneities can deflect the delivery point into unintended directions.

Once the lateral ROI and injection/emplacement volume are specified and the ROI is determined, these data are scaled up across the treatment zone. How this is done depends on the strategy. For grid patterns, the delivery locations and ROI are overlain on a map of the TTZ. For inject and drift, spacing between points in a given transect is based on the ROI. The spacing between transects is the sum of the ROI plus the distance amendment will travel during drift, which is estimated by groundwater seepage velocities and the rate at which amendment will be consumed. For barrier applications the spacing within transects depends on the ROI. Groundwater velocity and ROI should be used to estimate groundwater residence time in the barrier treatment zone. The groundwater residence time is usually estimated using the hydraulic conductivity and the gradient. The residence time can be increased by adding a second offset and parallel transect of injection locations, to ensure there are no dead spots in the barrier that would let contaminants through. Multiple barriers across the site will likely be required for large plumes (Appendix E.13, Former Industrial Site Characterization and Remediation in Fractured Rock), and/or plumes with slow groundwater flow rates.

When specifying the number and spacing of delivery locations, and the volume to be delivered at each, the following should be considered.

  • Use of a greater number of more closely spaced points will result in more reliable distribution, all else being equal.
  • Injection of a greater volume at each point results in greater distribution away from each point. However, there is a practical limit to how much volume can be injected. Preferential flow through higher permeability zones can result in repeatedly treating high permeability zones or excursions of amendment outside the TTZ when high volumes are injected.

To overcome vertical stratification of amendment at heterogeneous sites, most often after adequate high-resolution characterization has been performed to identify these intervals, several methods can be used.

  • Direct push points with delivery performed at discrete (e.g., 0.3 m or 0.6 m) zones can force more uniform distribution, assuming equal volumes are injected at each depth. Note that in heterogeneous formations, the delivery pressure, or time allotted, will be highly variable at different depths when using this approach.
  • Injection wells with shorter screens can be used with nested wells when the TTZ is relatively thick.
  • Where soluble amendments are to be delivered into a plume of dissolved contaminants generally created by advective flow, the use of a recirculation system can more widely and rapidly deliver the amendment. The recirculation system consists of paired extraction and injection wells, a treatment/amendment addition system, and associated piping. It is used to extract groundwater, possibly treat it if necessary, amend the water with compounds suitable for the desired in situ treatment process, and inject the solution into the subsurface. The locations on the extraction and injection wells are chosen to strategically distribute the amended water in an optimal fashion while controlling the plume.
  • The paired extraction and injection increase the hydraulic gradient, and this speeds the travel of the amendment relative to the natural gradient. In addition, the nature of the flow paths for water traveling from an injection to a paired extraction well expand outward before converging on the extraction well. This results in a generally better lateral distribution of amendment. Overall, the use of paired extraction and injection serves to increase the well spacing and reduce the number of injection points. This offsets at least part of the capital cost for the extraction system.
  • If 3-dimensional heterogeneity is relatively well known (e.g., via hydraulic tomography (ITRC 2015)), targeted, and perhaps multiple, simultaneous injection and extraction points, and multiple packed-off zones, could be used for pumping/injection flow control to guide injection to desired volumes.
  • Phytoremediation systems can be used to influence hydraulic control. They perform in a manner similar to extraction wells, without the need for recirculation. The coupling of in situ injection strategies with phytoremediation is best used in conjunction with aerobic or oxidizing amendments in areas where the hydraulic conductivity is low. Phytoremediation may also offer a polishing step or can be used in transects parallel to injection transects./li>

3.7.2 Number of Delivery Locations and Volume for Injection of Slurries/Solids

▼Read more

When delivering amendments, the number of points and their spacing depend on how far the amendment will travel from the point of injection. Similar to injection of liquids, the spacing depends on selecting a target ROI and then determining how to perform the injection such that the target ROI is achieved. Because the injection of slurries/solids is nearly always performed by specialized contractors, such contractors should be consulted to determine the required delivery parameters. Alternatively (or in conjunction with), the ROI can be assessed with a site-specific pilot test.

Amendment distribution is extremely stratified with depth when materials are injected into fractures. The fractures themselves contain amendments in the concentration that were injected, while the remainder of the subsurface may not receive any amendment during the initial emplacement. Where fractures are parallel to groundwater flow (i.e., horizontal fractures and approximately horizontal groundwater flow), natural groundwater flow will likely not cause contaminants to intersect the emplaced amendment. In these cases, diffusion is the primary mechanism through which amendments are delivered to contaminants away from the fractures (Siegrist 2001) or contaminants into the amendment in the fractures (ITRC 2017a, b). A detailed study of permanganate transport away from fractures found that permanganate diffused approximately 0.3 m outward from fractures in each direction in approximately one year (Siegrist 2001).

3.8 Delivery Strategies

Whether via permanent, fixed points or temporary locations, amendment distribution through a porous aquifer media is controlled by the nature of the amendment (soluble, semisoluble, or insoluble), the permeability of the formation, the volume of amendment added, and the pressure at which the fluid is applied to the formation.

Advection-dominated transport controls the flow of groundwater, contaminants, and amendments. These high permeability zones often receive the most fluids, allow broadest radial delivery, and are therefore key to determining injection location spacing. As a result, these zones are often where the most rapid and extensive treatment gains can be achieved. Advection-dominated transport includes rock and soils with large hydraulic conductivity values (fractured limestones, gravels, sands), but can also zones of moderate relative permeability (silty sands, clayey sands) with slower rates of advection compared to storage zones dominated by diffusion (see Section 3.5.3.1). To avoid driving contamination outside the treatment area, it may be advantageous to begin injection near the fringe of the plume/aqueous phase and progress upgradient where multiple injections are required.

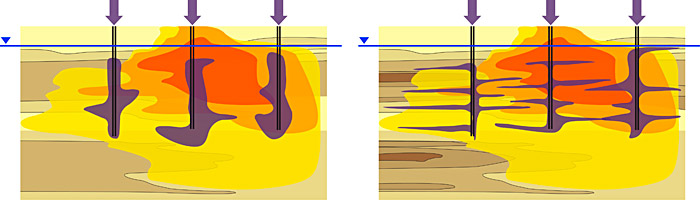
A variety of amendments are available to promote biological or chemical transformation, depending on the properties of a specific target contaminant. These amendments all have different chemical properties that control their introduction and transport through the subsurface and potentially limit the injection methods available. The particle size of many solid-phase amendments such as oxygen-releasing materials, ZVI, or activated carbon is larger than most pore throats and prevents delivery through well screens. High-pressure emplacement technologies using hydraulic or pneumatic methods are therefore required to deform the aquifer matrix and propagate seams (fractures) within the aquifer matrix. Conversely, soluble amendments like organic carbon substrates and chemical oxidants can be delivered under gravity flow or at low pressure via permanent or temporary well screens and via high-pressure fracturing methods.

Given that natural aquifer conditions control both contaminant and amendment transport, mapping the contaminant distribution within the aquifer architecture is key to determining what delivery approach to select. Wells and fracture-based injection points can both be successfully used for delivery through more permeable advective soils, but the applicability of injection wells declines as the matrix become less permeable. To address contaminants residing in lower hydraulic conductivity zones, fracturing technologies are used to propagate amendments at the desired target depth. In these cases, fractures are established to serve as new zones of higher permeability within the rock matrix. Amendments with greater longevity emplaced within these fractures can diffuse into lower permeability soils adjacent to the fracture and provide treatment of contaminants migrating from the low permeability zones into the new fracture interval.

Finally, injection method selection is determined based on site access constraints and remedial goals. For sites where only one injection or emplacement event is planned, or where the installation of permanent injection wells is infeasible, temporary injection points and emplacement-based methods are often preferred. When multiple injection events are expected and the rock matrix is more permeable or conducive to well-based delivery, it is often more economical to install permanent injection wells to reduce overall project life cycle cost.

3.8.1 Injection Screening Matrix

▼Read more

The injection/screening matrix (Table 3-4) features six delivery methods as column headers. Along the far-left column is a list of subsurface characteristics that influence the applicability of the injection methods. The cells of the table contain one of three parameters/terms:

“Widely used = ●”, “Site-specific = ▣”, and “Not applicable = NA”

Select the hydrogeologic or physical characteristics that best fit the site-specific TTZ of injection (targeted mass or groundwater zone). The selected row/cells will indicate the general feasibility of the various delivery technologies. For example, nearly all the delivery technologies can be “widely used” for very coarse sands (sandy to gravelly) except for electrokinetics, which is site-specific.

When one or more delivery technologies have been selected for the TTZ based on its characteristics and/or conditions at the site, the next step is to click on the appropriate column header to link to specific fact sheets. Each fact sheet discusses four topics:

  • types of equipment
  • types of delivery
  • advantages of this delivery technique
  • limitations to this delivery technique

As noted in Table 3-4, Solid Injection Principles [D4] appears as a master header over Hydraulic Delivery and Pneumatic Delivery to present an understanding of these two delivery methods for injecting solid amendments.

Table 3-4. Injection screening matrix.
“Widely used = ●”, “Site-specific = ▣”, and “Not applicable = NA”

Delivery Technique Direct Push Injection (DPI)
[D1]
Injection Through Wells & Boreholes
[D2]
Electrokinetics This is injection through wells.
[D3]
Solid Injection
[D4]
Permeable Reactive Barriers (PRBs)
[D7]
Hydrogeologic Characteristics
Unified Soil Classification System
Hydraulic Delivery Through Wells & Boreholes
[D5]
Pneumatic Delivery Through Open Boreholes
[D6]
Gravels ● (Sonic) ● NA NA NA ●
Cobbles ● (Sonic) ● NA NA NA ●
Sandy Soils (Sm, Sc, Sp, Sw) ● ● NA ▣ ▣ ●
Silty Soils (Ml, Mh) ● ▣ ● ● ● ●
Clayey Soils (Cl, Ch, Oh) ● ▣ ● ● ● ●
Weathered Bedrock ● ● ▣ ● ● ▣
Competent/Fractured Bedrock NA ● NA ▣ ▣ ▣
K ≤ 10-3 to 10-4 (Low Perm Soils) ● ▣ ● ● ● ●
K ≥ 10-3 (High Perm Soils) ● ● ▣ ▣ ▣ ●
Depth > Direct Push Capabilities NA ● ▣ ▣ ▣ ▣

3.8.2 Material Compatibility and Other Safety Considerations

▼Read more

When making delivery equipment decisions, the primary concern is how the reagents will react with the materials of construction in some way, possibly compromising the integrity of either the reagent or the equipment parts (hoses, fittings, seals, pipes, etc.) that come into contact with the amendment. Reviewing Safety Data Sheets (SDS) for the amendment compatibility is important to understand each component’s specific chemical and physical properties. In addition, the compatibility of the reagents/amendments should be considered with the specific types of plastics, grades of steel, types of O-rings of all of the equipment, conveyance infrastructure, and well materials anticipated to contact the amendment. Injection contractors can provide detailed information regarding their equipment and its compatibility with different amendments. The sequence and timing of mixing solutions that will initiate reactions (e.g., the reaction between catalysts and oxidants) should be discussed in detail with the manufacturer and the injection contractor to mitigate adverse material compatibility. Some materials result in corrosive or exothermic reactions when combined (e.g., sodium persulfate or hydrogen peroxide and iron activators).

Other safety precautions to consider include checking the age and condition of tooling, pump tightness testing that is a water test in the field prior to initiating reagent injections), installing adequately sized whip-checks at pressurized connections, and securing an adequate exclusion work space or buffer zone within the line of fire protection. These are a few safety concerns and are not meant to serve as an exhaustive list of potential safety issues.

Both ionic and nonionic species can be mobilized through the formation via different electrokinetic processes (Factsheet D3). Compatible reagents include a wide array of oxidants, pH buffers, salts, and catalytic reagents.

3.8.3 Implementation

▼Read more

When the user has selected the amendments and confirmed that the delivery technique is compatible with both the target zone subsurface conditions and equipment for that delivery, the user is ready to proceed to Section 4, Implementation and Feedback (Monitoring) Optimization.

image_pdfPrint this page/section
Click here to download the entire document.

glossary

OIS-ISRP

Download Complete Document
glossaryOIS-ISRP-1
Glossary
referencesOIS-ISRP-1
References
acronymsOIS-ISRP-1
Acronyms

ITRC
Contact Us
About ITRC
Visit ITRC
social media iconsClick here to visit ITRC on FacebookClick here to visit ITRC on TwitterClick here to visit ITRC on LinkedInITRC on Social Media
Permission is granted to refer to or quote from this publication with the customary acknowledgment of the source (see suggested citation and disclaimer). This web site is owned by ITRC • 1250 H Street, NW • Suite 850 • Washington, DC 20005 • (202) 266-4933 • Email: [email protected] • Terms of Service, Privacy Policy, and Usage Policy ITRC is sponsored by the Environmental Council of the States.